Top benefits of google analytics for Business

Introduction

Data is a crucial driver for business success in today’s digital age. With the correct information, making informed decisions can be easy. This is where Google Analytics steps in. It’s a powerful tool that helps businesses understand their online presence. By providing insights into website traffic and user behavior, Google Analytics enables enterprises to make smarter decisions.

Imagine having a clear picture of who visits your website, what they do there, and what brings them back. With Google Analytics, you can. This tool allows you to track various metrics that are crucial for improving your business strategies. From understanding your audience to optimizing your marketing efforts, Google Analytics offers a range of benefits that can help your Business grow.

Understanding Google Analytics

Google Analytics also allows you to set specific goals. These goals could be getting visitors to sign up for a newsletter, fill out a contact form, or buy a product. By tracking these goals, you can see how well your website is helping you reach your business targets.

What is Google Analytics?

Google Analytics is a tool that helps you understand how people use your website. It’s like having a particular pair of glasses that lets you see what visitors do when they come to your site. Google has made this tool, and it’s free to use.

When you add Google Analytics to your website, it collects information about every visit. It can tell you how many people visit your site daily, where they come from, and what pages they look at. This is very helpful because it gives you a clear picture of how your website is doing.

Top 10 Benefits of Google Analytics for Business

Enhanced Decision Making

Google Analytics helps you make better decisions for your Business. It provides detailed data about your website visitors, such as where they come from, what they do on your site, and how long they stay. This information is crucial because it shows you what’s working and what isn’t. For example, if most of your traffic comes from social media, you might focus more on social media marketing. Using data from Google Analytics allows you to make informed choices that lead to better business results.

Improved Marketing ROI

Marketing can be expensive, so knowing which efforts bring the best results is essential. Google Analytics tracks all your marketing campaigns and shows you how they perform. You can see which ads or posts get the most clicks and conversions. This helps you focus your budget on the most effective strategies. For example, you can allocate more funds to email marketing if an email campaign drives more sales than a social media ad. This way, you get the best return on investment (ROI) for your marketing dollars.

Better Customer Understanding

Knowing your customers is critical to serving them well. Google Analytics provides insights into your audience’s demographics, interests, and behaviors. You can see details like age, gender, location, and even the devices they use. This helps you understand who your customers are and what they want. For instance, if you notice that many of your audience are young adults, you might tailor your content and products to fit their preferences. Understanding your customers better leads to improved customer satisfaction and loyalty.

Enhanced Website Performance

Your website’s performance is crucial for keeping visitors engaged. Google Analytics helps you monitor key metrics like page load times, bounce rates, and session durations. If you see that a particular page has a high bounce rate, it means visitors leave quickly. You can then investigate and fix issues like slow loading times or confusing content. By improving your website’s performance, you ensure a better user experience, which can lead to higher engagement and conversions.

Tracking Business Goals and KPIs

Setting and tracking goals is essential for any business. Google Analytics allows you to set specific goals, like newsletter sign-ups, purchases, or form submissions. It then tracks how well you’re meeting these goals. You can also monitor key performance indicators (KPIs) necessary for your Business. This helps you see if you’re on track to meet your objectives. For example, if your goal is to increase sales by 20%, you can track real-time progress and adjust as needed.

Competitive Advantage

Staying ahead of your competitors is vital in any industry. Google Analytics can help you gain a competitive edge by providing insights into market trends and consumer behavior. You can benchmark your performance against industry standards and identify areas for improvement. For instance, if your competitor’s website has a lower bounce rate, you can analyze their strategies and apply similar tactics to your site. You can outperform your competitors and capture a larger market share by staying informed and proactive.

Identifying Market Trends

Understanding market trends can help you make strategic decisions. Google Analytics provides data that can reveal emerging trends in your industry. For example, you might notice increased mobile traffic, indicating that more people are browsing on their phones. You can then optimize your website for mobile users. By keeping an eye on trends, you can adapt your business strategies to meet changing market demands and stay relevant.

Cost-Effective Solution

Google Analytics is free, making it a cost-effective solution for businesses of all sizes. Despite being free, it offers comprehensive features that rival paid analytics tools. This means you can get valuable insights without a hefty price tag. For small businesses or startups with limited budgets, Google Analytics provides a powerful tool to drive growth and make data-driven decisions without breaking the bank.

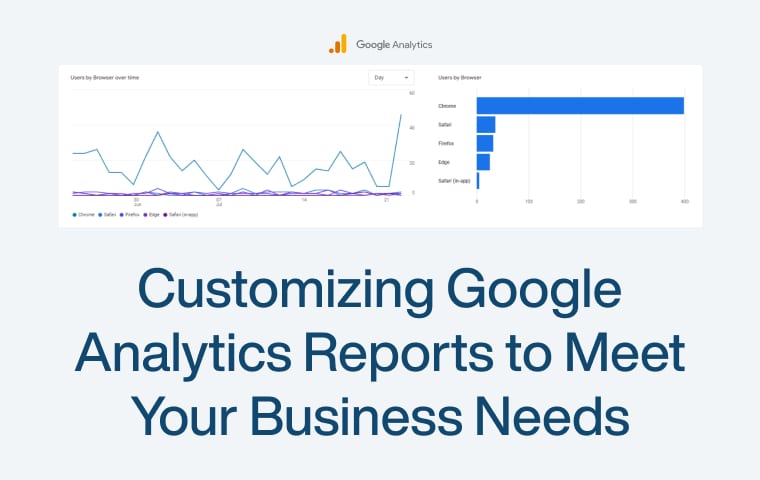
Customizable Reports and Dashboards

One of Google Analytics’s standout features is its customizable reports and dashboards. You can create tailored reports that focus on the metrics most important to your Business. This allows you to quickly access the data you need without sifting through irrelevant information. Custom dashboards provide a visual overview of your key metrics, making it easier to spot trends and make quick decisions. This flexibility ensures that you have the right data at your fingertips whenever you need it.

Integration with Other Tools

Google Analytics seamlessly integrates with other tools and platforms, enhancing its functionality. For example, you can link it with Google Ads to track the performance of your ad campaigns. Integration with Google Search Console provides insights into your site’s search results performance. You can connect it with third-party tools like CRM systems for a more holistic view of your customer journey. This integration capability makes Google Analytics a central hub for your business data, helping you make well-rounded decisions.

These ten benefits show how Google Analytics can be a game-changer for your Business. By leveraging its features, you can make informed decisions, improve your marketing efforts, and better understand your customers. This leads to increased efficiency, higher ROI, and business growth.

Practical Tips for Maximizing Google Analytics

Google Analytics is a powerful tool, but you need to know how to use it effectively to get the most out of it. Here are some practical tips to help you maximize Google Analytics for your Business.

Set Clear Goals

Before diving into Google Analytics, set clear goals for what you want to achieve. These could include increasing website traffic, boosting sales, or getting more sign-ups. Having specific goals helps you focus on the data that matters most.

Use Custom Dashboards

Google Analytics lets you create custom dashboards. These dashboards show the data you care about most, all in one place. For example, you can have a dashboard that tracks top-performing pages, traffic sources, and conversion rates. Custom dashboards save you time and help you stay focused on key metrics.

Track Important Events

Events in Google Analytics are actions visitors take on your site, like clicking a button, watching a video, or downloading a file. Setting up event tracking lets you see how users interact with your site. This helps you understand what works well and what needs improvement.

Monitor Site Search

If your website has a search bar, you can use Google Analytics to see what visitors are searching for. This is called Site Search. It helps you understand what information people seek and if they find it easily. You can use this data to improve your site’s content and navigation.

Segment Your Audience

Audience segmentation allows you to break down your data into smaller groups based on specific criteria like location, device, or behavior. For example, you can create segments for mobile users versus desktop users. This helps you see how different groups interact with your site and tailor your strategies accordingly.

Set Up Alerts

Google Analytics lets you set up custom alerts to notify you when certain conditions are met. For example, you can set an alert for a sudden drop in traffic or a spike in conversions. These alerts help you quickly identify and address issues, ensuring your site runs smoothly.

Use Annotations

You can add annotations to your Google Analytics data to mark significant events, like a website redesign, a new marketing campaign, or a special sale. These notes help you understand the context behind changes in your data and make better decisions.

Regularly Review Reports

Make it a habit to review your Google Analytics reports regularly. Weekly or monthly check-ins help you stay on top of trends and spot any issues early. This proactive approach ensures you can make timely adjustments to your strategies.

Link with Other Tools

Google Analytics works well with other tools like Google Ads, Search Console, and third-party platforms. Linking these tools gives you a complete view of your marketing efforts and website performance. For example, integrating with Google Ads lets you see which keywords drive the most traffic and conversions.

Keep Learning

Google Analytics is a robust tool with many features. Use online resources, tutorials, and courses to learn and improve your skills. The more you know, the better you can leverage the data to grow your Business.

Google Analytics is an invaluable tool for businesses seeking more profound insights into their online presence. Understanding how visitors interact with your website allows you to make informed decisions that drive success. From setting clear goals and creating custom dashboards to tracking important events and monitoring site searches, there are many ways to maximize the benefits of Google Analytics. Segmenting your audience, setting up alerts, using annotations, and regularly reviewing reports can further enhance your data analysis. Linking Google Analytics with other tools and continuously learning about its features ensures you stay ahead in the competitive digital landscape. Following these practical tips, you can leverage Google Analytics to improve your website, optimize marketing efforts, and ultimately achieve your business objectives.

How to Efficiently Export Data from Google Analytics

Google Analytics is a powerful tool that helps us understand how people use our websites. It gives us a lot of data, but sometimes, we need to take this data out of Google Analytics to use it in other ways. This is called exporting data.

Exporting data from Google Analytics is essential because it lets us look at our information more closely. We can make reports for our bosses, check if our marketing is working, or keep a data backup.

This blog will teach us how to export data from Google Analytics quickly and easily. We will discuss different ways to export data, tips to smooth the process, and how to solve common problems. By the end of this blog, you will know the best ways to get your data out of Google Analytics and use it to improve your business.

Understanding the Need for Data Export

Exporting data from Google Analytics is essential for various reasons. Here’s a detailed look at why you might need to export your data:

Reporting to Stakeholders

  • Clear Communication: Only some people in your organization may be familiar with Google Analytics. Exporting data allows you to present it in a more understandable format.
  • Regular Updates: Stakeholders often require regular updates on website performance. Exporting data helps create consistent, scheduled reports that can be shared easily.
  • Tailored Information: Customize reports to highlight the most relevant metrics for different stakeholders, ensuring they get the information they need.

In-Depth Data Analysis

  • Detailed Examination: While Google Analytics provides robust tools, exporting data to programs like Excel or Google Sheets allows for more complex and detailed analysis.
  • Custom Calculations: Perform specific calculations and create custom metrics that may not be available in Google Analytics.
  • Pattern Recognition: Use advanced features and tools to identify trends and patterns that can inform your marketing and business strategies.

Data Backup and Security

  • Data Safety: Keeping a data backup protects against accidental loss or issues within Google Analytics.
  • Historical Data: Maintaining historical data ensures you can always refer back to past performance, even if it’s no longer available in Google Analytics.
  • Compliance: Meet data compliance requirements by storing data securely and having access to it when needed.

Custom Reporting

  • Flexibility: Create custom reports that cater to specific needs or questions. Google Analytics provides great insights, but a custom report is sometimes more effective.
  • Combining Data Sources: Merge Google Analytics data with other data sources to comprehensively view your business performance.
  • Enhanced Insights: Tailor the data to show correlations and insights specific to your business goals.

Enhanced Data Visualization

  • Professional Presentations: Use advanced visualization tools to create more polished and professional-looking reports.
  • Interactive Dashboards: Develop interactive dashboards, allowing stakeholders to explore the data independently.
  • Better Understanding: Well-designed charts and graphs make it easier for everyone to understand the data, leading to better decision-making.

Methods to Export Data from Google Analytics

There are several ways to export data from Google Analytics. Each method has advantages and is suitable for different needs. This section will explain these methods to help you choose the best one for your requirements.

Manual Export Methods

Manual export methods are simple and quick ways to get your data from Google Analytics. Here’s how you can do it:

Exporting Reports Directly from Google Analytics:

  • Accessing Reports: Go to the specific report you want to export in Google Analytics.
  • Export Options: Click the “Export” button at the top of the report. You will see options to export your data in CSV, Excel, and PDF.
  • Choosing the Format: Select the format that best suits your needs. CSV and Excel are suitable for further analysis, while PDF is great for sharing simple reports.
  • Downloading the File: Once you select the format, the file will download to your computer. You can then open it using the appropriate software.

Using Google Sheets for Manual Export:

  • Google Analytics Add-on: You can use the Google Analytics add-on for Google Sheets. First, install the add-on from the Google Workspace Marketplace.
  • Setting Up: After installing, open Google Sheets, go to “Add-ons” in the menu, and select “Google Analytics” followed by “Create a new report.”
  • Creating a Report: Fill in the required details like account, property, view, and metrics you want to export. Click “Create Report” to generate the report in your Google Sheet.
  • Refreshing Data: You can refresh the data in the sheet to get the latest information without exporting again.

Tips and Best Practices for Manual Exports

  • Choosing the Right File Format: Best for data analysis as you can manipulate and sort the data. Useful for simple, unchangeable reports to share with others.
  • Scheduling Exports: Set a routine to export your data regularly. This ensures you always have the latest data and can make timely decisions.
  • Organizing Files: Keep your exported files well-organized on your computer or cloud storage. This makes it easy to find and use the data when needed.

Manual export methods are straightforward and do not require advanced technical skills. They are ideal for small businesses or individual users who need quick and easy access to their Google Analytics data.

Automated Export Methods

Automated export methods save time and ensure you always have the latest data without needing to do it manually. Here’s how you can automate your data export from Google Analytics:

Using Google Analytics APIs:

  • Google Analytics Reporting API: This API allows you to access your Google Analytics data programmatically.
  • Setting Up API Access:Go to the Google Cloud Console, create a new project, and enable the Google Analytics Reporting API. Set up OAuth 2.0 to connect to the API securely. Fill scripts in Python or JavaScript to fetch data. You can schedule these scripts to run regularly, ensuring your data is always up-to-date.
  • Benefits: The API allows for highly customized data exports and can handle large amounts of data efficiently.

Utilizing Third-Party Tools and Integrations:

  • Introduction to Tools: Supermetrics A popular tool that connects Google Analytics with Google Sheets, Excel, and data visualization platforms like Data Studio. Funnel.io Another tool that automates data collection and can combine data from multiple sources, not just Google Analytics.
  • Setting Up Integrations: The tool best fits your needs and budget. Follow the tool’s instructions to connect your Google Analytics account. Set up the tool to export your needed data. You can often schedule exports to run daily, weekly, or monthly.
  • Pros: Easy to set up, no coding needs, integrates with many other platforms.
  • Cons: Some tools may have costs associated with them, and they might limit the amount of data you can export.

Benefits of Automated Export Methods

  • Time-Saving: Automated methods run without your intervention, saving you valuable time.
  • Consistency: Regular, automated exports ensure your data is always up-to-date and available when needed.
  • Scalability: Automated methods can handle large volumes of data and complex reports, which is ideal for growing businesses.

Best Practices for Efficient Data Export

Exporting data from Google Analytics can be straightforward, but following best practices ensures the process is smooth and the data is valid. Here’s a detailed look at these best practices:

Ensuring Data Accuracy and Completeness:

  • Double-check Settings: Always verify your settings before exporting. Ensure the correct date range, filters, and segments are applied to capture the necessary data. Incorrect settings can lead to incomplete or irrelevant data.
  • Verify Data: After exporting, review the data for accuracy. Compare it with the data in Google Analytics to ensure everything is present and correct. Look for anomalies or unexpected values that might indicate issues with the export.
  • Regular Updates: Update your export settings periodically to include any new data points or changes in your analytics setup. This keeps your exports relevant and comprehensive.

Optimizing Data Export Processes:

  • Use Templates: Create templates for recurring reports. This saves time and ensures consistency. Templates can also standardize the structure and formatting of your reports, making them easier to read and analyze.
  • Schedule Regular Exports: Automate your data exports to run regularly (daily, weekly, monthly). This keeps your data current without requiring manual effort each time. Automation tools or Google Analytics’ built-in scheduling features can be used for this purpose.
  • Organize Your Files: Maintain a well-organized folder structure for your exported files. Use clear and consistent naming conventions, including dates and descriptions, to make it easy to locate specific reports quickly.

Using the Right Tools:

  • Select Appropriate Formats: Choose the correct file format based on your needs: CSV and Excel, Ideal for further analysis and manipulation in spreadsheet programs.PDF, Best for static reports that are shared with stakeholders and don’t require further editing. Google Sheets, Convenient for collaboration and real-time updates.
  • Leverage Automation Tools: Supermetrics, Funnel.io, and Google Analytics APIs can automate data exports. These tools reduce manual work, ensure timely exports, and allow for more complex data handling.

Data Cleaning and Preparation:

  • Remove Duplicates: Ensure there are no duplicate entries in your exported data, as these can skew your analysis and lead to incorrect conclusions.
  • Format Data Properly: Clean and format your data for easy analysis. This includes setting up proper headers, ensuring consistent data types (e.g., dates in the same format), and removing unnecessary columns or rows that do not add value to your analysis.

Regularly Reviewing Exported Data:

  • Analyze Trends: Review your exported data regularly to identify trends and insights. This will help you make informed decisions and adjust your strategies based on current data.
  • Adjust Export Settings: Certain data points are more relevant than others based on your analysis. Adjust your export settings to capture these data points and refine your filters and segments for more precise data.

Ensuring Data Security:

  • Backup Data: Always keep backups of your exported data. Reliable cloud storage solutions like Google Drive, Dropbox, or external drives can be used to prevent data loss.
  • Access Control: Ensure that only authorized personnel can access the exported data. Use passwords, encryption, and secure sharing methods to protect sensitive information from unauthorized access.

Exporting data from Google Analytics is essential for anyone who wants to make the most out of their website’s performance data. Whether creating reports for your team, analyzing trends, or keeping backups, understanding the different data export methods can save you time and effort.

We discussed two main methods of exporting data: manual and automated. Manual exports are simple and quick, perfect for small tasks or when you need specific data occasionally. Automated exports, on the other hand, are significant for regular, large-scale data needs. They save time and ensure your data is always up-to-date.

Following best practices ensures that your data export process is smooth and your data is accurate and useful. Double-checking settings and templates and organizing your data are just a few tips that can help you work more efficiently.

Top Google Analytics Alternatives for Businesses: A Comparative Guide 

Introduction

In today’s digital age, understanding your website’s performance is more critical than ever. Businesses rely on data to make informed decisions, improve user experiences, and boost sales. Google Analytics is one of the most popular tools for tracking and analyzing website data. It’s a powerful tool used by millions around the world.

However, Google Analytics might be a better fit. Some businesses look for alternatives due to privacy concerns, the need for specific features, or just wanting something more straightforward to use. Luckily, many other analytics tools can meet different needs and preferences.

This guide will explore some of the best alternatives to Google Analytics. We’ll examine what makes each tool unique, their pros and cons, and how they compare to Google Analytics. Whether you’re a small business owner or part of a large corporation, this guide will help you find the right analytics tool for your needs.

Criteria for Choosing an Analytics Tool

Choosing the right analytics tool for your business is very important. The right tool helps you understand your customers and make better decisions. Here are some key factors to think about when picking an analytics tool:

Cost

First, consider your budget. Analytics tools come in all price ranges. Some are free, like Google Analytics, while others are expensive. Think about how much you are willing to spend. Ensure you choose a tool that gives you good value for your money.

Features

Look at what each tool offers. Do you need detailed reports, real-time data, or specific integrations? Make a list of the features that are most important for your business. For example, some tools offer heat maps that show where users click the most on your website. Others might provide advanced segmentation to understand different user groups. Choose a tool that has the features you need to meet your goals.

Ease of Use

The tool should be easy to use. You should use it more effectively if it’s too complicated. Look for a tool with a simple interface. It should be easy to navigate and understand. Some tools offer tutorials and guides to help you get started. A user-friendly tool will save you time and make getting the insights you need more accessible.

Integration Capabilities

Check if the tool works well with other software you use. This could include your CRM (Customer Relationship Management), email marketing tools, or e-commerce platform. Good integration means you can easily combine data from different sources. This gives you a complete view of your business and saves you from manually entering data into multiple systems.

Data Privacy and Compliance

Make sure the tool follows data privacy laws like GDPR. This is very important if you handle sensitive customer information. A tool that values privacy will keep your data safe. Look for tools that offer data encryption and secure storage. Also, check if they have certifications or follow industry standards for data protection.

Customer Support

Good customer support is crucial. Look for tools that offer helpful resources, like tutorials and live chat support. This can make a big difference if you run into any issues. Some tools provide 24/7 support, while others might only be available during business hours. Check the level of support offered and make sure it meets your needs.

Consider these factors to find an analytics tool that fits your business needs. Remember, the best tool for one business might not be the best for another. Choose the one that aligns with your goals and requirements.

Top 5 Google Analytics Alternatives

Google Analytics is a popular choice for website analytics. However, some businesses may prefer better alternatives. Here are five great options that offer unique features and benefits.

Matomo

Matomo is an open-source analytics tool that gives you complete control over your data. Here’s why it’s a great alternative to Google Analytics:

  • Data Ownership: With Matomo, you own your data. You can store it on your servers or choose a cloud option. This is important for businesses concerned about privacy.
  • Features: Matomo offers many features similar to those of Google Analytics. It includes visitor logs, heat maps, and session recordings. You can see what users do on your site and understand their behavior.
  • Ease of Use: The interface is user-friendly. Even if you need to be more tech-savvy, you can navigate through and find the necessary information: Matomo integrates well with many platforms. Whether using WordPress, Joomla, or another CMS, Matomo can fit right in.
  • Cost: Matomo offers a free self-hosted version and a paid cloud version, which start at a reasonable price. This makes it a flexible option for different budgets.

Adobe Analytics

Adobe Analytics is a powerful tool used by many large businesses. It offers advanced features and deep insights.

  • Advanced Reporting: Adobe Analytics provides detailed reports. You can also create custom dashboards and visualizations to see the metrics that most matter to you.
  • Real-Time Data: With real-time data, you can see what’s happening on your site as it happens. This is useful for monitoring live events or promotions.
  • Integration: Adobe Analytics integrates with other Adobe products like Adobe Experience Cloud. This can provide a seamless experience if you’re already using Adobe tools.
  • Customization: The tool is highly customizable. You can set up specific tracking for unique events or goals on your site.
  • Cost: Adobe Analytics is a premium product and can be expensive. It’s best suited for larger businesses with bigger budgets.

Piwik PRO

Piwik PRO is similar to Matomo but focuses more on privacy and compliance.

  • Privacy: Piwik PRO is designed with privacy in mind. It helps businesses comply with GDPR and other privacy laws. Your data is stored securely, and you have complete control over it.
  • Features: Piwik PRO offers comprehensive features, including user profiles, funnels, and custom reports. You can track user journeys and see how they interact with your site.
  • Ease of Use: The interface is straightforward to navigate. Even beginners can get valuable insights without much hassle.
  • Integration: Piwik PRO integrates with many third-party tools. This includes popular CMS platforms and marketing tools.
  • Cost: Piwik PRO offers a free version with basic features. For more advanced features, there is a paid version. The pricing is flexible and can fit different business sizes.

Mixpanel

Mixpanel is an excellent tool for businesses needing to detail user interactions.

  • Event Tracking: Unlike traditional page view tracking, Mixpanel focuses on events. You can track user actions on your site or app, such as button clicks or form submissions.
  • User Segmentation: Mixpanel allows you to segment users based on their behavior. This helps you understand different user groups and tailor your marketing efforts.
  • Ease of Use: The interface is intuitive. You can set up tracking and create reports without needing technical skills.
  • Integration: Mixpanel integrates with many other tools, such as CRMs and marketing platforms, making it easy to combine data from different sources.
  • Cost: Mixpanel offers a free version with basic features. Paid plans are available for more advanced features. The pricing can be higher, but it provides good value for detailed analytics.

Heap

Heap is a user-friendly analytics tool that focuses on automatic data collection.

  • Automatic Tracking: Heap tracks every user interaction automatically. You don’t need to set up specific events or tags, making it easy to get started and ensuring you get all the data.
  • User Insights: Heap provides detailed user insights. You can see what users do on your site and how they navigate through it.
  • Ease of Use: The tool is straightforward to use. You can create reports and analyze data without any technical knowledge.
  • Integration: Heap integrates with various tools, including CRMs and email marketing platforms. This helps you get a complete view of your user data.
  • Cost: Heap offers a free version with essential features and paid plans for more advanced features. The pricing is competitive and suitable for different business sizes.

How to Transition to a New Analytics Tool

Switching to a new analytics tool can seem challenging, but you can make the process smooth and thrive with the proper steps. Here’s a simple guide to help you transition to a new analytics tool.

Evaluate Your Needs

Before you switch, understand what you need from your new analytics tool. Ask yourself questions like:

  • What features are most important for my business?
  • Do I need real-time data or detailed reports?
  • How important is data privacy to me?

Make a list of your requirements. This will help you choose a tool that fits your needs.

Choose the Right Tool

Once you know your needs, start researching different analytics tools. Compare their features, costs, and ease of use. Look for reviews and testimonials from other users. Ensure the tool you choose aligns with your business goals and is easy for your team.

Plan the Transition

Planning is critical to a smooth transition. Create a step-by-step plan that includes:

  • When will you start the transition
  • Who will be responsible for different tasks
  • How you will handle data migration

Set clear timelines and assign tasks to team members. Having a plan in place will help you stay organized and avoid disruptions.

Backup Your Data

Before you make any changes, backup your existing data. This ensures you keep essential information during the transition. Export your data from your current analytics tool and save it securely. This way, you have a copy to refer to if anything goes wrong.

Set Up the New Tool

Next, set up your new analytics tool. Follow the installation instructions provided by the tool’s vendor. This usually involves adding tracking codes to your website. Make sure the tool is correctly installed and tracking data is accurate.

Migrate Your Data

Migrate your old data to the new tool. Some analytics tools offer data import features. If this is impossible, keep your old data in a separate file for reference. This helps you maintain historical data and compare past performance with new data.

Train Your Team

Make sure your team knows how to use the new tool. Provide training sessions and resources to help them get familiar with the new interface and features. Many analytics tools offer tutorials and customer support to help you get started.

Monitor the Transition

Keep an eye on the transition process. Check that the new tool is collecting data correctly and that reports are accurate. If you notice any issues, address them quickly. Regular monitoring helps you catch and fix problems early.

Update Your Processes

Update your business processes to include the new analytics tool. This might involve changing how you collect data, analyze reports, or share insights with your team. Make sure everyone understands the latest processes and follows them consistently.

Review and Optimize

After the transition, review how the new tool works for you. Are you getting the insights you need? Is the tool easy to use? Collect feedback from your team and look for ways to optimize your tool use. Regular reviews help you get the most out of your analytics tool.

Transitioning to a new analytics tool doesn’t have to be complicated. By following these steps, you can make the process smooth and ensure you continue to get valuable insights from your data. Remember, planning and communication are critical to a successful transition.

Understanding your website’s performance is crucial for success in the digital world. While Google Analytics is a powerful tool, there are other options. Many businesses seek alternatives for various reasons, such as privacy concerns, the need for specific features, or ease of use.

This guide has explored top alternatives to Google Analytics, including Matomo, Adobe Analytics, Piwik PRO, Mixpanel, and Heap. Each tool offers unique features and benefits that can help you gain deeper insights into your website’s performance and user behavior.

Matomo stands out for its focus on data ownership and privacy. Adobe Analytics offers advanced reporting and integration capabilities, making it ideal for larger businesses. Piwik PRO emphasizes compliance with privacy laws, while Mixpanel and Heap provide detailed user interaction tracking and ease of use.

20 Yellow Company Logos from Famous Brands

When we think about famous brands, colours play a big part in how we recognize them. Yellow is one of those colours that stands out. It’s bright, cheerful, and grabs our attention. But why do so many companies choose yellow for their logos?

Yellow is a colour that makes us feel happy and cheerful—like a little ray of sunshine. This is why brands use yellow—they want us to feel good about their products.

Psychology Behind Yellow Colour in Branding

Yellow is an exceptional colour in branding. It’s bright, warm, and catches your eye quickly. But why do so many brands choose yellow for their logos? Let’s look at the reasons behind this choice.

Happiness and Positivity

Yellow is often linked with happiness and positivity. It’s the colour of sunshine and smiles. When people see yellow, they can feel cheerful and optimistic. Brands use yellow to create a happy feeling around their products.

Attention-Grabbing

Yellow stands out. It’s easy to see, even from a distance, which is why it’s used in warning signs and taxis. Brands also use yellow in their logos to grab your attention quickly, helping them stand out in a crowded market.

Warmth and Energy

Yellow is a warm colour. It gives a feeling of warmth and energy, like the sun. Brands want to share this warm and energetic feeling with their customers. It makes the brand feel welcoming and lively.

Youthfulness and Fun

Yellow is also a playful and fun colour. It’s often used in products for kids because it feels youthful and lively. Brands that want to show they are fun and energetic often use yellow in their logos.

Confidence and Optimism

Yellow can also be a colour of confidence and optimism. It’s bright and bold, showing that the brand is confident and forward-thinking. Brands use yellow to show optimism about the future and are ready to face new challenges.

Company Logos: 20 Examples from Well-Known Brands

Let’s explore these 20 well-known brands’ logos in more detail. Each has a unique story and reason for choosing yellow, which helps them connect with their customers and stand out in the market.

McDonald’s

McDonald's Logo

McDonald’s golden arches are one of the most recognizable logos worldwide. The yellow arches represent joy, warmth, and friendliness. They aim to make customers feel welcome and happy, which aligns with their goal of providing a cheerful dining experience.

Shell

Shell Logo

Shell’s logo features a bright yellow shell with a red outline. The yellow colour symbolizes energy, positivity, and optimism, which is fitting for an energy company. It reflects the bright future of sustainable energy and innovation.

Ferrari

Ferrari Logo

The Ferrari logo, featuring a prancing horse on a yellow background, stands for luxury, speed, and excellence. The yellow background adds a touch of prestige and excitement, making the brand synonymous with high performance and elite status.

Denny’s

go

Denny’s is a well-known American diner chain that has become famous for its 24/7 service and wide variety of comfort foods. The yellow in Denny’s logo plays a significant role in its branding, creating a warm and inviting atmosphere. Here’s a closer look at why Denny’s uses yellow and what it means for the brand.

Snapchat

Snapchat Logo

Snapchat’s ghost logo on a bright yellow background is playful and fun, ideally targeting its young, dynamic user base. The yellow background represents creativity, joy, and spontaneity, core aspects of Snapchat’s brand identity.

IKEA

IKEA’s blue text on a yellow background represents their Swedish roots and commitment to affordable home furnishings. Yellow signifies happiness, positivity, and comfort, reflecting IKEA’s mission to bring joy and practicality into homes.

National Geographic

National Geographic Logo

The yellow rectangle frame of National Geographic is a symbol of exploration, discovery, and knowledge. Yellow represents curiosity and the endless pursuit of learning about our world, aligning perfectly with National Geographic’s adventurous spirit.

CAT (Caterpillar)

CAT (Caterpillar) Logo

CAT’s logo, featuring a yellow triangle, signifies strength, durability, and reliability. Yellow reflects their machinery’s industrial and construction nature, conveying a sense of trust and dependability in harsh conditions.

Post-it

Post-it Logo

The yellow Post-it sticky note logo is practical, easily visible, and associated with creativity and organization. The bright yellow ensures that notes stand out, making them effective reminders in personal and professional settings.

Subway

Subway Logo

Subway’s green and yellow logo promotes freshness, health, and energy. The yellow colour helps convey the idea of fresh and fast food, making it appealing to those looking for a quick yet healthy meal option.

Chupa Chups

Chupa Chups’ yellow flower-like logo, designed by Salvador Dalí, is playful and eye-catching. Yellow represents joy, delight, and fun, perfectly matching the sweet, enjoyable experience of eating Chupa Chups lollipops.

Lay’s

Lay's Logo

Lay’s logo features a yellow sunburst behind the text, symbolizing joy, warmth, and flavour. The yellow background makes the brand look inviting and tasty, encouraging consumers to enjoy their chips.

DHL

DHL Logo

DHL’s red text on a yellow background stands for speed, efficiency, and reliability. The yellow indicates its commitment to fast and dependable delivery services, making it a trusted choice for shipping and logistics.

Best Buy

Best Buy Logo

Best Buy’s yellow price tag logo concerns deals, savings, and affordability. Yellow catches the eye and conveys a sense of urgency and value, clearly showing that Best Buy offers excellent products at competitive prices.

Bic

Bic Logo

Bic’s yellow background with the pen character stands for reliability, simplicity, and everyday use. Yellow makes the brand look friendly and approachable, aligning with its goal of providing dependable writing tools.

Toblerone

Toblerone Logo

Toblerone is a well-known Swiss chocolate brand famous for its unique triangular shape and distinct logo. The Toblerone logo features a yellow background, which plays a significant role in its brand identity. Let’s explore why Toblerone uses yellow and what it signifies.

Hertz

Hertz Logo

Hertz’s black text on a yellow background stands out clearly, symbolizing energy, movement, and accessibility. The yellow background reflects their service in the car rental industry, highlighting their commitment to providing fast and easy transportation solutions.

Stanley

Stanley Logo

Stanley is a well-known brand in the world of tools and hardware. Their logo, which features a bold yellow background with black text, is instantly recognisable and carries significant meaning. Let’s explore why Stanley chose yellow for their branding and what it represents.

Kodak

Kodak Logo

Kodak’s iconic yellow and red logo is iconic in the world of photography. Yellow stands for innovation, creativity, and the bright memories its products capture. It emphasizes the brand’s long-standing commitment to helping people preserve their precious moments.

Warner Brothers

Warner Brothers

Warner Brothers is one of the most iconic names in the entertainment industry. Their logo, featuring the famous WB shield, has become synonymous with quality films and television shows. While the primary colours of the logo have varied over the years, the use of yellow in some versions has played a significant role in its branding. Let’s explore why Warner Brothers chose yellow and what it means for their brand.

Do you know How Top Brands Use Color Psychology in Logo Design?

Creating the Perfect Pairing with Yellow Company Logos: What Goes with Yellow?

When designing a logo, choosing the right colour combination is crucial. Yellow is a bright, cheerful colour that grabs attention, but pairing it with the right colours can make it even more effective. Let’s explore some colours that go well with yellow and why they work.

Yellow & Black

Black is a strong and bold colour that pairs well with yellow. The contrast between yellow and black makes the logo stand out. It’s easy to read and catches the eye. Brands like CAT and Hertz use this combination to show strength and reliability.

Yellow & Red

Red is a vibrant colour that complements yellow nicely. Together, they create a sense of urgency and excitement. This combination is perfect for brands that want to convey energy and action. DHL and McDonald’s use red and yellow to create a lively and engaging logo.

Yellow & Blue

Blue and yellow create a harmonious and balanced look. Blue is calm and trustworthy, while yellow is warm and cheerful. This pairing is great for brands that want to show they are dependable and friendly. IKEA’s logo is a perfect example of this combination.

Yellow & Green

Green and yellow together represent growth, freshness, and positivity. This combination is ideal for health, nature, or food brands. Subway uses green and yellow to highlight the freshness and healthiness of their food options.

Yellow & White

White is a neutral colour that makes yellow pop even more. It gives the logo a clean and modern look, making it simple yet striking. National Geographic uses yellow and white to keep its logo clean and focused on exploration and knowledge.

Yellow & Grey

Grey is a subtle and sophisticated colour that pairs well with yellow. It tones down the brightness of yellow while maintaining its cheerful vibe. This combination is good for brands that want to appear professional yet approachable.

Yellow & Brown

Brown and yellow together give a warm and earthy feel. This pairing is great for brands that want to convey a sense of nature, tradition, or reliability. The combination creates a grounded and comfortable look.

In conclusion, the color yellow in company logos isn’t just a bright and eye-catching choice—it’s a strategic decision that communicates warmth, energy, and optimism. This roundup of 20 famous brands utilizing yellow in their logos demonstrates how this vibrant color can be harnessed to capture attention and evoke the emotions companies want associated with their brand identity. From the fast-food giants to tech start-ups, yellow proves to be versatile and effective in creating memorable and impactful branding. As we’ve seen, whether it’s standing alone or complemented by other colors, yellow has the power to lift a brand’s visual appeal and leave a lasting impression on consumers. When considering color in your own brand’s logo, think about what yellow could symbolize for your company and how it might be used to forge a deeper connection with your audience.

Customizing Google Analytics Reports to Meet Your Business Needs

Understanding your website’s performance is crucial for making intelligent business decisions in today’s data-driven world. Google Analytics is a powerful tool that provides a wealth of data about your site’s visitors and behavior. But with so much information, finding the insights that matter most to your business can be overwhelming.

This is where customizing Google Analytics reports come in. By tailoring these reports to fit your specific needs, you can focus on the most relevant metrics. This helps you make informed decisions that drive growth and success.

Understanding the Basics of Google Analytics

Google Analytics is a free tool from Google that helps you track and understand your website’s performance. It collects data about your visitors and their actions on your site, which is crucial for making informed decisions to improve your business.

What is Google Analytics?

Google Analytics is like a diary for your website. It records who visits your site, how they found it, what they do while they’re there, and much more. This data helps you understand what’s working well and what needs improvement.

Key Features of Google Analytics

  • Real-Time Data: See who is on your site and what they do.
  • Audience Reports: Learn about your visitors, such as their age, location, and interests.
  • Acquisition Reports: Find out how visitors find your site, whether through search engines, social media, or other sources.
  • Behavior Reports: Understand what visitors do on your site, which pages they visit, and how long they stay.
  • Conversion Tracking: Track necessary actions like sales, sign-ups, or form submissions.

Why Use Google Analytics?

Google Analytics helps you make sense of your website data. With it, you can:

  • Improve User Experience: Find out which pages are popular and which ones need work.
  • Boost Marketing Efforts: See which campaigns bring in the most visitors.
  • Increase Sales: Track which products are selling and understand your customers’ journey.

Setting Up Google Analytics

To start using Google Analytics, you need to:

  • Create an Account: Sign up for a free Google Analytics account.
  • Add Tracking Code: Place a small code on your website to start collecting data.
  • Set Goals: Define what actions you want to track, such as purchases or sign-ups.

Once set up, Google Analytics begins to collect data, which you can view in various reports. These reports give you a clear picture of how your site is performing and where you can make improvements.

Step-by-Step Guide to Customising Google Analytics Reports

Customizing Google Analytics reports can help you focus on the data that matters most to your business. Here’s a step-by-step guide to doing it.

Step 1: Setting Up Google Analytics

  • Creating an Account First, you need a Google Analytics account. Go to the Google Analytics website and sign up. If you already have a Google account, you can use that to sign in.
  • Adding Tracking Code: Once you have an account, Google Analytics will give you a tracking code. You need to add This small piece of code to your website. If you need help with how to do this, you might need help from a web developer. This code collects data about your visitors and sends it to Google Analytics.

Step 2: Accessing Custom Reports

  • Navigating to Custom Reports After setting up your account and adding the tracking code, log into Google Analytics. On the left side of the screen, you’ll see a menu. Click on “Customisation,” then “Custom Reports.”
  • Creating a New Custom Report To create a new report, click on the “New Custom Report” button. This will take you to a page where you can set it up.

Step 3: Key Elements of Custom Reports

  • Metrics Metrics are the numbers in your reports. They measure how many visitors you have, how long they stay on your site, and how many pages they visit. For example, “Sessions” is a metric that tells you how often your site was visited.
  • Dimensions Dimensions describe your data. They tell you about the “who,” “what,” and “where” of your metrics. For example, “Source/Medium” is a dimension that tells you where your visitors came from, like from a search engine or a social media site.
  • Using Filters Filters helps you focus on specific data. For example, if you only want to see data from mobile users, you can set a filter to show only that information. To add a filter, go to your custom report setup page and click “Add Filter.”
  • Creating Segments Segments are similar to filters but more flexible. They allow you to look at specific groups of users. For example, you can make a segment for users who have purchased. Click “Add Segment” in the report view to add a segment.

Step 4: Customising Reports for Different Business Needs

  • E-commerce Tracking If you run an online store, you can set up e-commerce tracking to see data on sales, product performance, and customer behavior.
  • Key Metrics: Look at revenue, conversion rate, and average order value metrics.
  • Custom E-commerce Reports Create reports that show sales by product, sales by source, and shopping behavior.
  • Content Tracking For content sites, tracking which articles or videos are popular can help you understand what your audience likes.
  • Key Metrics Focus on metrics like pageviews, time on page, and bounce rate.
  • Custom Content Reports Create reports that show top-performing pages, user engagement, and traffic sources.
  • Service Tracking Track inquiries, bookings, or form submissions.
  • Key Metrics Important metrics include goal completions, user flow, and source/medium.
  • Custom Service Reports: Create reports that show conversion rates, user paths, and lead sources.

Step 5: Advanced Customisation Techniques

  • Using Google Data Studio Google Data Studio is another tool for using Google Analytics. It allows you to create interactive dashboards with your data.
  • Scheduled Email Reports: You can set up reports to be emailed regularly. This keeps you updated without having to log in every time.
  • Using API for Customisation For more advanced users, Google Analytics offers an API for obtaining data and creating custom solutions.

Customising Reports for Different Business Needs

Different businesses need different insights. Here’s how to customize reports for specific types of companies.

E-commerce Business

  • E-commerce Tracking: Set up e-commerce tracking to see data on sales, product performance, and customer behavior.
  • Key Metrics: Focus on revenue, conversion rate, and average order value metrics.
  • Custom Reports: Create reports that show sales by product, sales by source, and shopping behavior.

Content-Based Business

  • Content Tracking: Track which articles or videos are popular to understand what your audience likes.
  • Key Metrics: Look at pageviews, time on page, and bounce rate.
  • Custom Reports: Create reports that show top-performing pages, user engagement, and traffic sources.

Service-Based Business

  • Service Tracking: Track inquiries, bookings, or form submissions to understand user interactions.
  • Key Metrics: Important metrics include goal completions, user flow, and source/medium.
  • Custom Reports: Create reports that show conversion rates, user paths, and lead sources.

Advanced Customisation Techniques

Advanced customization techniques can provide deeper insights and more powerful reports for businesses that want to get more out of Google Analytics. Here are some advanced methods to consider.

Using Google Data Studio

  • Integration with Google Analytics: Google Data Studio is a free tool that allows you to create detailed, interactive dashboards using your Google Analytics data. Integrating it with Google Analytics is simple. You need to connect your Google Analytics account to Data Studio.
  • Creating Interactive Dashboards: With Google Data Studio, you can create interactive dashboards that provide a visual representation of your data. These dashboards can include charts, graphs, and tables that update in real-time. They are useful for sharing insights with your team in a clear and engaging way.
  • Benefits of Interactive Dashboards: Visual insights make complex data easier to grasp. Real-time data ensures dashboards update automatically with the latest information. Customization allows you to tailor dashboards to focus on the metrics that matter most to your business.

Automating Reports

  • Scheduled Email Reports: You can save time by setting up Google Analytics to email you reports on a regular schedule. This ensures you receive up-to-date data without having to log in every time. To set up scheduled email reports, go to the report you want to plan, click on “Share” and then “Email,” choose the frequency (daily, weekly, monthly), and enter your email address.
  • Using API for Customisation: Google Analytics offers an API (Application Programming Interface) for more advanced users. This allows you to extract data and create custom solutions beyond what the standard interface offers. You can use the API to pull specific data, automate tasks, and integrate Google Analytics data with other tools or systems.
  • Benefits of Using the API: The API provides flexibility to access data in ways not possible through the standard interface. Automation saves time by handling repetitive tasks. Integration allows you to combine Google Analytics data with other business tools for a comprehensive view.

In conclusion, customizing Google Analytics reports is critical for businesses aiming to align their digital analytics with specific strategic goals. By tailoring reports to reflect the most relevant data, you streamline the decision-making process and gain deeper insights into what drives success in your particular context. Whether setting up custom dashboards, utilizing filters, or creating segmented reports, each modification helps paint a clearer picture of your business’s online performance. As you become more proficient in adjusting these reports, you’ll find that 

Google Analytics is not just a tool for tracking traffic but a powerful ally in optimizing your business operations and enhancing customer engagement. Remember, the ultimate aim of customization is to make data work for you, providing actionable insights that propel your business forward. Start small, experiment with different configurations, and continually refine your approach to harness the full potential of Google Analytics tailored to your unique business needs.

Google Analytics API: Best Practices for Security and Data Privacy

In today’s digital landscape, data is a critical asset for businesses, providing valuable insights into customer behavior, marketing performance, and operational efficiency. Google Analytics is a powerful tool that enables companies to collect and analyze this data to drive informed decisions. With the Google Analytics API, developers can access and manipulate data programmatically, integrating analytics capabilities into custom applications and workflows.

However, as data becomes more integral to business operations, ensuring its security and privacy has never been more crucial. Mishandling data can lead to severe consequences, including data breaches, regulatory penalties, and loss of customer trust. Therefore, adopting best practices for security and data privacy when using the Google Analytics API is essential.

Understanding Google Analytics API

The Google Analytics API is a set of tools that lets you access and use data from your Google Analytics account flexibly. Instead of manually logging into Google Analytics to see your data, the API allows you to pull this data automatically. This can save you a lot of time and enable you to integrate Google Analytics data into your applications, websites, or reporting tools.

What is Google Analytics API?

The Google Analytics API is like a bridge between your data and your applications. It helps you retrieve data such as the number of visitors to your site, the sources of your traffic, the behavior of your users, and more. This can be especially useful for businesses seeking more profound insights into their online performance.

Core Functionalities

The API provides a range of functionalities, including:

  • Data Collection: You can automatically collect data on website visits, user behavior, and conversions.
  • Data Reporting: You can generate custom reports highlighting the metrics and dimensions most relevant to your business.
  • Data Analysis: You can use the data to analyze trends, compare performance over time, and better understand user interactions.
  • Automation: You can automate regular tasks, such as reporting, to save time and ensure consistency.

Use Cases and Benefits

There are many ways businesses use the Google Analytics API:

  • Custom Dashboards: Create tailored dashboards that show the exact data you need in a format that suits your business.
  • Integration with Other Tools: Integrate Google Analytics data with other tools, such as CRM systems or marketing platforms, to get a unified view of your customer data.
  • Enhanced Reporting: Develop more detailed and customized reports that go beyond the default reports available in Google Analytics.
  • Automation: Automate routine tasks like data retrieval and reporting, reducing manual work and the risk of human error.

Security Best Practices

The Google Analytics API can bring many benefits, but keeping your data safe and secure is essential. Here are some best practices to help you protect your data when using the API.

Authentication and Authorisation

OAuth 2.0 Authentication: Always use OAuth 2.0 for authentication. It is a secure way to allow your application to access the API on behalf of a user. OAuth 2.0 uses tokens instead of passwords, making it much safer.

How to Implement OAuth 2.0: Follow Google’s guidelines for setting up OAuth 2.0. Use short-lived tokens that expire quickly and refresh them as needed. This reduces the risk of a token being compromised.

Managing and Rotating API Keys: If you use API keys, ensure they are kept secret and rotated regularly. If a key is exposed, it can be used to access your data.

Secure Data Transmission

Use HTTPS: Always use HTTPS to encrypt data transmitted between your application and the Google Analytics API. This ensures that data cannot be intercepted or tampered with during transmission.

Ensuring Secure Data Exchange: Ensure your server configurations enforce HTTPS and restrict HTTP access. This adds an extra layer of security for data exchanges.

Access Controls

Set Proper User Roles and Permissions: Only give access to those who need it. Use Google Analytics user management features to assign appropriate roles and permissions. This limits the risk of unauthorized access.

Limit Access to Sensitive Data: Not all data should be accessible to everyone. Create specific user accounts with limited permissions for accessing sensitive data. This follows the principle of least privilege.

Monitoring and Auditing

Regularly Monitor API Usage: Monitor how the API is being used. Look for unusual activity that might indicate a security issue. Google Analytics provides tools to monitor API usage effectively.

Setting Up Alerts: Set up alerts to notify you of unusual or suspicious activities, such as access from unfamiliar IP addresses. Early detection can help prevent breaches.

Auditing Access Logs: Regularly audit your access logs to see who is accessing your data and when. This can help you spot any irregularities and address potential security concerns quickly.

Data Privacy Best Practices

Protecting data privacy is crucial when using the Google Analytics API. Here are some best practices to ensure your data remains private and secure.

Compliance with Privacy Regulations

Understand Privacy Laws: Be aware of laws like GDPR (General Data Protection Regulation) in Europe and CCPA (California Consumer Privacy Act) in the United States. These laws dictate how you should collect, store, and use data.

Ensuring Compliance: Ensure your data practices follow these laws. For instance, users should always obtain their consent before collecting their data and provide options to opt-out.

Anonymising User Data

Anonymise IP Addresses: Instead of storing complete IP addresses, use Google Analytics’ IP anonymization feature. This helps protect user identities by removing the last part of their IP address.

Pseudonymisation: Replace private information with pseudonyms. For example, instead of storing a user’s name, store a code representing them. This way, even if data is leaked, it’s harder to trace it back to individuals.

Data Minimisation

Collect Only What You Need: Avoid collecting more data than necessary. If you don’t need specific information, don’t collect it. This reduces the risk of your data being compromised.

Regular Data Reviews: Periodically review the data you collect and keep. Delete any information that is no longer needed. This helps minimize the amount of data exposed in a breach.

User Consent and Transparency

Obtain Explicit Consent: Always obtain explicit consent from users before collecting their data. This can be done through consent forms or pop-ups on your website.

Provide Clear Privacy Policies: Have a clear and easy-to-understand privacy policy. Explain what data you collect, why, how it is used, and who it is shared with. This helps users trust you with their data.

Managing User Data

Allow Users to Access and Delete Their Data: Allow users to see what data you have about them and delete it if they wish. This is a legal requirement in many places and builds trust.

Responding to Data Requests: Be prepared to respond promptly to user requests about their data. Have a system in place to handle these requests efficiently.

Managing API Security and Privacy in Practice

Implementing security and privacy measures is essential when using the Google Analytics API. Here’s how you can manage these aspects effectively in real-world scenarios.

Using Google Cloud’s Security Features

Google Cloud Identity and Access Management (IAM): Google Cloud IAM helps you manage who has access to your data and what they can do with it. By setting up IAM, you can control who can view, edit, or delete your Google Analytics data. Use roles and permissions to limit access to only what is necessary for each user.

Security Best Practices for Google Cloud: To protect your data, follow Google Cloud’s security guidelines. This includes using strong passwords, enabling two-factor authentication (2FA), and regularly updating your security settings. Google Cloud provides tools to help you monitor and manage security, so take advantage of these resources.

Third-Party Integrations and Security

Evaluating Third-Party Tools: Before integrating third-party tools with your Google Analytics API, ensure they comply with security and privacy standards. Check their privacy policies, security certifications, and user reviews to ensure they handle data responsibly.

Ensuring Secure API Integrations:

  • When integrating third-party tools, use secure methods to exchange data.
  • Please ensure the data is encrypted during transfer and that the third party can only access the needed data.
  • Regularly review and audit these integrations to ensure they remain secure.

Regular Security Audits

Conducting Regular Audits: Regularly audit your API usage and security settings. Look for unusual activity, review access logs, and check for any changes in user permissions. Audits help you identify potential security issues before they become problems.

Addressing Security Issues Promptly: If you find any security issues during your audits, address them immediately. This might involve changing passwords, updating security settings, or revoking access for specific users. Quick action can prevent minor issues from becoming major security breaches.

Educating Your Team

Training on Security Best Practices: Ensure your team understands the importance of security and privacy. Provide training on best practices, such as recognizing phishing attempts, using strong passwords, and following data protection guidelines.

Keeping Up with Security Updates:

  • Stay informed about the latest security threats and updates.
  • Regularly update your systems and applications to protect against new vulnerabilities.
  • Encourage your team to stay up-to-date with security training and resources.

Ensuring security and data privacy when using the Google Analytics API is crucial for protecting your data and maintaining user trust. You can secure your API usage effectively by following best practices in authentication, data transmission, access control, and monitoring. Additionally, adhering to privacy regulations, anonymizing data, minimizing data collection, and ensuring user consent are vital steps to safeguard privacy.

In practice, utilizing Google Cloud’s security features, carefully managing third-party integrations, conducting regular audits, and educating your team are essential to maintaining a secure environment. These measures help prevent data breaches and ensure compliance with legal requirements.

The Role of Google Analytics in SEO: What You Need to Know

In the digital age, having a well-optimized website is essential for attracting and retaining visitors. Search Engine Optimization (SEO) is the key to achieving this, helping your site rank higher in search engine results and drawing more organic traffic. But how do you know if your SEO efforts are truly effective? This is where Google Analytics comes in. Google Analytics is a powerful tool that provides detailed insights into your website’s performance, helping you understand what’s working and needs improvement. 

What is Google Analytics?

Google Analytics is a free tool from Google that helps you understand how people use your website. It collects visitor data, like how they found your site, which pages they looked at, and how long they stayed. This information is essential because it helps you see what’s working well and needs improvement.

With Google Analytics, you can track many things, such as the number of visitors, where they come from, and what devices they use. It also shows how visitors move through your site and which pages they visit the most. You can set goals to track specific actions, like purchasing or filling out a contact form, to see how well your site performs.

Setting up Google Analytics is easy. Sign up for an account, add your website details, and paste a tracking code into your HTML. This code collects data and sends it to your Google Analytics account, where you can view detailed reports.

The Connection Between Google Analytics and SEO

Google Analytics and SEO (Search Engine Optimization) work together to help you improve your website’s visibility and performance. Understanding how these two are connected can make your SEO efforts more effective. Let’s break it down:

Tracking Organic Traffic

Google Analytics shows how many visitors find your site through search engines. This is called organic traffic. By monitoring organic traffic, you can see if your SEO strategies bring in more visitors. More organic traffic means your SEO is working well.

Understanding Bounce Rate

Bounce rate is the percentage of visitors who leave your site after viewing only one page. A high bounce rate might mean your site needs to give visitors what they want. Google Analytics helps you find these pages so you can make them better. Lowering your bounce rate can improve your SEO rankings.

Analyzing Average Session Duration

Average session duration tells you how long visitors stay on your site. More extended visits usually mean that people find your content valuable. Google Analytics helps you track this metric to see which pages keep visitors engaged and which need improvement.

Monitoring Pages per Session

Pages per session show how many pages a visitor looks at during one visit. More pages per session can mean your site is exciting and engaging. Google Analytics helps you understand this behavior, allowing you to create a more engaging site structure that improves SEO.

Identifying Traffic Sources

Google Analytics shows where your visitors come from, such as search engines, social media, or direct visits. This helps you understand how well your SEO efforts perform compared to other channels. Knowing your traffic sources enables you to focus on the most effective strategies.

Optimizing Landing Pages

Landing pages are visitors’ first pages when they arrive at your site. Google Analytics shows you which pages are the most common entry points. By optimizing these pages, you can improve user experience and boost your SEO rankings.

Essential Google Analytics Reports for SEO

Google Analytics provides several key reports essential for understanding and improving your SEO. These reports give you valuable insights into how your website is performing. Let’s explore them:

Acquisition Reports

Traffic Sources: This report shows where your visitors come from, such as search engines, social media, or direct visits. It helps you see how effective your SEO is compared to other channels.

Organic Search Traffic: This part of the acquisition report focuses on traffic from search engines. It tells you how many visitors find your site through organic search, which is a crucial indicator of your SEO performance.

Behavior Reports

Pageviews and Unique Pageviews: These metrics show how often each page on your site is viewed. Pageviews count all visits, while unique pageviews count each visitor only once. This helps you see which pages are the most popular.

Top Landing Pages: This report shows visitors’ first pages when they arrive at your site. Knowing which pages are common entry points can help you optimize them for better SEO.

Exit Pages: This report shows visitors’ last pages before leaving your site. Identifying pages with high exit rates can help you identify areas for improvement.

Conversion Reports

Goals and Conversions: In Google Analytics, you can set goals to track specific actions, like form submissions or purchases. This report shows how well your site achieves these goals, helping you understand if your SEO efforts lead to valuable actions.

E-commerce Tracking: If you run an online store, this report provides detailed information about sales, including revenue, transactions, and product performance. This data is crucial for understanding the ROI of your SEO efforts.

Using Google Analytics to Identify SEO Opportunities

Google Analytics is a powerful tool for finding ways to improve your SEO. Looking at specific data, you can see what’s working and needs improvement. Here’s how you can use Google Analytics to spot SEO opportunities:

Finding High-Performing Keywords

Google Analytics can show you which keywords bring visitors to your site. Look at the search terms that lead to high traffic and long visit durations. These keywords work well, and you can create more content around them to attract more visitors.

Identifying Underperforming Pages

Not all pages perform the same. Some might have high bounce rates or low average session durations. Google Analytics helps you find these pages. By improving the content or structure of these pages, you can keep visitors engaged and reduce bounce rates, boosting your SEO.

Analyzing User Behavior

Understanding how visitors interact with your site can reveal areas for improvement. Look at metrics like pages per session and average session duration. If visitors are not spending much time on your site or not viewing many pages, you may need to improve your site’s content or navigation.

Discovering New Content Opportunities

Google Analytics can show you what topics or types of content are popular with your audience. Look at the most visited pages and the search terms that bring people to your site. Use this information to create new content that meets your audience’s interests and needs, helping to drive more organic traffic.

Advanced Google Analytics Features for SEO

Google Analytics has advanced features that can give you deeper insights into your SEO performance. These features help you customize and analyze your data in more detail. Here’s how you can use them:

Custom Dashboards and Reports

Custom Dashboards: You can create custom dashboards to see all your important metrics in one place. This makes it easy to monitor your SEO performance at a glance.

Custom Reports: Custom reports allow you to focus on specific data that matters most. You can set up reports to track particular keywords, landing pages, or traffic sources, giving detailed insights into your SEO efforts.

Segmentation and Filtering

Segmentation: Segmentation lets you break down your data into smaller groups. For example, you can segment your audience by location, device, or behavior. This helps you understand how different groups of visitors interact with your site and tailor your SEO strategies accordingly.

Filtering: Filtering allows you to exclude specific data from your reports. For instance, you can filter out internal traffic (visits from your team) to get a clearer picture of your audience’s behavior.

Setting Up Custom Alerts

Custom Alerts: Custom alerts notify you when specific changes occur on your site. For example, you can set up an alert to be notified if your organic traffic drops suddenly. This helps you respond quickly to potential issues and keep your SEO performance on track.

Integrating Google Search Console with Google Analytics

Google Search Console Integration: By linking Google Search Console with Google Analytics, you can access more detailed search data. This integration helps you see how your site performs in search results, which keywords bring in traffic, and how users interact with your site after finding it in a search.

Google Analytics and Technical SEO

Google Analytics is not just for tracking visitors; it’s also a valuable tool for understanding and improving the technical aspects of your SEO. Here’s how Google Analytics helps with technical SEO:

Monitoring Site Speed

Site Speed Reports: Google Analytics reports your site’s loading speed. Site speed is crucial for both user experience and SEO. Slow-loading pages can lead to higher bounce rates and lower search engine rankings. Use these reports to identify and fix slow pages.

Improving Load Times: Analyzing the Site Speed reports can reveal which pages take the longest to load. Focus on optimizing these pages by compressing images, reducing server response times, and minimizing JavaScript and CSS.

Identifying and Fixing Crawl Errors

Crawl Error Reports: Google Analytics can show you crawl errors, especially when integrated with Google Search Console. Crawl errors occur when search engines have trouble accessing your pages. Fixing these errors ensures that all your content is indexed and available in search results.

Resolving Issues: Look for 404 errors (page not found) and server errors in the crawl reports. Fixing these errors can improve your site’s visibility and user experience. Redirect broken links to relevant pages to keep visitors on your site.

Analyzing Mobile vs. Desktop Performance

Mobile Performance: Google Analytics compares your site’s performance on mobile devices versus desktop. With more people using mobile devices, ensuring your site is mobile-friendly is essential.

Improving Mobile SEO: If your mobile performance is lagging, consider making your site responsive, improving mobile load times, and ensuring a good user experience on smaller screens. This can boost your mobile SEO and overall rankings.

Best Practices for Using Google Analytics in SEO

Using Google Analytics effectively can significantly improve your SEO efforts. Here are some best practices to help you get the most out of this powerful tool:

Regularly Monitor Key Metrics

Check Organic Traffic: Regularly monitor the number of visitors coming from search engines. This will help you see if your SEO efforts are paying off and if your traffic increases over time.

Track Bounce Rate: Monitor your bounce rate to determine whether visitors are finding what they need on your site. A high bounce rate may indicate that you must improve your content or site design.

Set Up and Track Goals

Define Clear Goals: Set specific goals in Google Analytics, such as form submissions, product purchases, or newsletter sign-ups. Tracking these goals helps you measure the success of your SEO strategies.

Monitor Goal Completions: Regularly check how many visitors complete these goals. This shows how effectively your site converts visitors into customers or leads.

Use Custom Dashboards and Reports

Create Custom Dashboards: Build custom dashboards to see all your important metrics in one place. This makes it easier to monitor your SEO performance at a glance.

Generate Custom Reports: Set up custom reports to focus on specific data that matters most to you. For example, track the performance of particular keywords, landing pages, or traffic sources.

Segment Your Audience

Use Segmentation: Segment your audience to understand different visitor behaviors. For example, compare new vs. returning visitors or analyze traffic from other locations. This helps you tailor your SEO strategies to different audience segments.

Analyze Segmented Data: Look at segmented data to find trends and patterns. This can reveal insights into which groups of visitors are most valuable and how you can better target them.

Integrate with Google Search Console

Link Google Search Console: Integrate Google Search Console with Google Analytics to get detailed search data. This shows you which keywords bring traffic and how users interact with your site after finding it in search results.

Use Search Console Reports: Analyze Search Console reports to understand your site’s search performance. This helps you identify opportunities to optimize your site for better rankings.

Google Analytics is an invaluable resource for anyone serious about improving their website’s SEO. You can comprehensively understand your site’s performance by tracking key metrics, setting goals, and using advanced features. This allows you to make data-driven decisions that enhance your SEO strategies, attract more visitors, and keep them engaged. Whether you’re just starting with SEO or looking to refine your existing efforts, Google Analytics provides the insights you need to succeed. Leveraging this tool effectively ensures your website reaches its full potential in search engine rankings and user experience.

Google Analytics for Beginners Guide

Understanding Google Analytics

Google Analytics is a free tool that tracks and reports website traffic. It helps you understand who visits your site, what they do, and how they interact with your content. This information is essential for improving your website and marketing efforts.

What is Google Analytics?

Google Analytics is a free tool from Google that helps you understand how people use your website. It collects visitor data, their Behavior, and how they interact with your site. By placing a small code on your web pages, Google Analytics tracks each visitor and provides detailed reports.

Think of it as a diary for your website. It tells you who visits, where they come from, what they do on your site, and how long they stay. This information can help you improve and make your website more user-friendly.

Why Use Google Analytics?

Using Google Analytics offers several benefits:

  • Understand Your Audience: Google Analytics helps you learn about your visitors. You can see where they come from, what devices they use, and even their age and interests. This information enables you to tailor your content and marketing efforts to better meet their needs.
  • Track Website Performance: It shows you how well your website is doing. You can see which pages are popular, how long visitors stay, and how they navigate your site. This helps you identify what works and what needs improvement.
  • Measure Marketing Effectiveness: You can track the success of your marketing campaigns. Google Analytics shows you which sources (like social media, search engines, or email campaigns) bring in the most traffic and conversions. This way, you know where to focus your efforts.
  • Set and Track Goals: You can set specific goals, like making a purchase or signing up for a newsletter, and track how well your website meets these goals. This helps you measure success and make data-driven decisions.
  • Improve User Experience: By understanding how users interact with your site, you can make informed changes to improve their experience. This can lead to higher engagement, more conversions, and happier visitors.

Getting Started with Google Analytics

First, create a Google Analytics account and set up a property for your website. Then, install the tracking code on your site to start collecting data. Finally, verify the installation to ensure it’s working correctly.

Setting up a Google Analytics Account

To begin using Google Analytics, follow these steps to set up your account:

Sign Up:

  • Go to the Google Analytics website.
  • Click “Start for free” or “Sign in”if you already have a Google account. If you don’t, you’ll need to create one.

Set Up Your Account:

  • Enter Account Name: This can be your business name or any name that helps you identify the account.
  • Create a Property: A property that represents your website or app. Enter your website’s name and URL (e.g., www.example.com), select your industry category from the dropdown menu, and choose your reporting time zone.
  • Select Data Sharing Settings: Choose how you want to share your Google Analytics data. These settings are optional and can be customized based on your preferences.

Create a Reporting View:

  • Name Your View: You can name this view anything, such as “All Website Data” or “Main View.”
  • Set View Settings: Customize settings like the website’s URL and exclude specific IP addresses if needed.
  • Click “Create” to finalize the setup. Your account and property are now created, and you’re ready to start collecting data.

Installing the Tracking Code

Once your account is set up, you need to install the tracking code on your website to start collecting data. Here’sHere’s how:

Get the Tracking Code:

  • In your Google Analytics account, go to the Admin section by clicking the gear icon at the bottom left.
  • Under the Property column, click on Tracking Info, then Tracking Code.
  • You’ll see a snippet of Code that starts with <script>. This is your unique tracking code.

Add the Code to Your Website:

  • Copy the Tracking Code: Highlight the entire code snippet and copy it.
  • Paste into HTML: Open your website’s HTML files or access your website’s backend if you’re using a CMS like WordPress. The Code should be placed just before the closing </head> tag in the HTML of each page you want to track. If you’re using a CMS, there are often plugins or settings where you can add this Code easily.

Verify the Installation:

  • After adding the tracking code to your website, return to Google Analytics.
  • Click on Real-Time in the reports section. If the tracking code is correctly installed, you should see activity from visitors on your site. You can also use tools like Google Tag Assistant to verify that the Code works correctly.

Exploring the Google Analytics Dashboard

Navigate the interface to find critical reports and data about your website. Customize the dashboard to focus on the metrics that matter most to you. Use Real-Time data analysis to see live visitor activity and immediate impacts of your marketing efforts.

Navigating the Interface

You’ll see the main dashboard when you first log in to Google Analytics. This is where you find all the reports and data about your website. On the left side, there’s a menu with different sections, like Real-Time, Audience, Acquisition, Behavior, and Conversions. Each section gives you specific insights. The main screen shows an overview with graphs and critical metrics like users, sessions, and bounce rate.

Customizing the Dashboard

You can customize your dashboard to see the information that matters most. Click on “Customization” in the left menu, then ” Dashboards.” Here, you can create a new dashboard or edit an existing one. You can add widgets that show different types of data, like line charts, pie charts, and tables. Customizing your dashboard helps you quickly access the most critical data for your goals.

Real-Time Data Analysis

Real-time reports show what’s happening on your website right now. To access this, click on “Real-Time” in the left menu. You’ll see how many people are currently on your site, what pages they’re viewing, and where they’re coming from. This is useful for monitoring live events, promotions, or new content. Real-time data helps you understand immediate user behavior and the impact of your marketing efforts as they happen.

Key Metrics and Standard Reports

Audience reports show who visits your site, acquisition reports reveal how they find it, and behavior reports explain what they do once they’re there. These insights help you understand your audience, track traffic sources, and improve user experience. Use this data to make informed decisions for your website.

Audience Reports

Audience reports help you understand who is visiting your website. They provide information about your visitors’ demographics (age, gender), interests, geography (location), and Behavior (new vs. returning visitors). These reports also show the devices your audience uses, such as mobile phones or desktops. By analyzing this data, you can tailor your content and marketing strategies to better meet your audience’s needs.

Acquisition Reports

Acquisition Reports show you how visitors find your website. They track your traffic sources, such as search engines, social media, direct visits, or referral links from other sites. You can see which channels bring in the most visitors and how effective your marketing campaigns are. This helps you understand which efforts drive traffic and which areas need improvement.

Behavior Reports

Behavior Reports tell you what visitors do on your website. They show which pages are most popular, how users navigate your site, and how long they stay on each page. You can see user behavior flow from page to page, helping you identify any bottlenecks or drop-off points. This information is crucial for improving user experience and content effectiveness.

Enhancing Your Analytics with Advanced Features

Set up Goals and Funnels in Google Analytics to track your site’s critical actions and user paths. Use Event Tracking to measure specific interactions like clicks and video plays. Implement Custom Dimensions and Metrics to collect data tailored to your business needs.

Setting Up Goals and Funnels

Setting Up Goals: Goals in Google Analytics help you measure how well your website achieves specific objectives. These objectives could include purchasing, signing up for a newsletter, or spending a certain amount of time on a page. To create a goal:

  • Navigate to the Admin section and select Goals under the View column.
  • Click on ” + New Goal” and choose from predefined templates or create a custom goal. You’ll need to define the goal type, such as Destination (tracking when users reach a specific page), Duration (tracking sessions that last a certain amount of time), Pages/Screens per Session (tracking users who visit multiple pages), or Event (tracking specific interactions like clicks or downloads).
  • Once set up, Google Analytics will begin tracking when users complete these actions, providing valuable data on how well your site meets its objectives.

Setting Up Funnels: Funnels in Google Analytics allow you to visualize users’ steps to complete a goal and see where they drop off along the way. During the goal setup process, you can define a series of steps that lead to the goal, such as visiting a product page, adding an item to the cart, and completing the checkout process. By specifying the URLs or actions for each step, you create a clear path that users follow. Google Analytics will then show the conversion rate for each step and highlight where users abandon the process. This information is crucial for identifying problem areas and optimizing your website to improve the user journey and increase conversions.

Event Tracking

Event Tracking in Google Analytics helps you measure specific interactions on your site that don’t involve loading a new page, such as button clicks, video plays, or file downloads. Add a small piece of Code to your website to set up event tracking. This Code sends information to Google Analytics whenever the specified Event occurs. You can also use Google Tag Manager to set up events without directly modifying your site’s Code. Events have parameters like Category (a group name for the object you want to track), Action (the type of interaction), Label (optional additional information), and Value (optional numerical value). By accessing the event data in the Behavior section under Events, you can see how often each Event occurs and gain insights into user interactions. This data helps you understand what content or features engage users and identify areas for improvement.

Custom Dimensions and Metrics

Custom Dimensions and Metrics in Google Analytics allow you to collect and analyze data specific to your business needs beyond the default tracking options. Custom Dimensions let you define additional attributes of your data, such as user types (e.g., logged-in vs. guest users) or content categories (e.g., blog post vs. product page). To create a custom dimension, go to the Admin section, select Custom Definitions under the Property column, and click on Custom Dimensions. Name your dimension and set its scope (hit, session, user, or product), then add the custom dimension code to your website. Custom Metrics allows you to track measurements like total purchases or average order value. To create a custom metric, follow a similar process in the Custom Definitions section. By adding the tracking code to your website, you can send data for these custom metrics to Google Analytics. Viewing this custom data in your reports gives you deeper insights tailored to your business, helping you make informed decisions and optimize your strategies for better results.

In conclusion, Google Analytics is an indispensable tool for anyone venturing into the digital space. Whether you’re running a small blog or managing a large e-commerce platform, the insights offered by Google Analytics can significantly enhance your understanding of your audience and the effectiveness of your marketing strategies. For beginners, mastering Google Analytics is less about learning to interpret vast amounts of data and more about understanding which metrics are most relevant to your goals. Start small, focusing on key performance indicators like traffic sources, user behavior, and conversion rates. As you grow more comfortable, you can delve deeper into advanced analytics to uncover richer insights and make more informed decisions. Remember, the power of Google Analytics lies not just in the data it gathers but in the improvements you make based on this information. Experiment, learn from the data’s feedback, and adapt your strategies accordingly. With dedication and practice, Google Analytics will soon become a crucial part of your digital toolkit, driving success and growth in your online endeavors.

Step-by-Step Guide to Measuring and Analysing Email Marketing Success

Introduction

Email marketing is a powerful tool for connecting with your audience and driving business growth. Measuring and analyzing your campaigns’ performance is crucial to harness its full potential. You understand what works and doesn’t allow you to optimize your strategies for better results.

This step-by-step guide will help you measure and analyze your email marketing success. We’ll create critical metrics to track, tools to use, and best practices for turning data into actionable insights. Whether you are new to email marketing or looking to refine your approach, this guide will provide the expertise you need to enhance your campaigns and achieve your marketing goals.

Identify Key Metrics

To measure and analyze your email marketing success effectively, focus on key metrics that provide insights into your campaign.

Open Rates: The percentage of recipients who open your email. High open rates indicate effective subject lines. Improve by using compelling, relevant, and personalized subject lines.

Click-Through Rates (CTR): The percentage of recipients who click on links in your email. CTR measures engagement and CTA performance. Enhance by creating clear, enticing CTAs and ensuring relevant content.

Conversion Rates: The percentage of recipients who complete a desired action, like making a purchase. This shows email effectiveness in driving actions. Optimize landing pages to align with email content and CTAs.

Bounce Rates: The percentage of undelivered emails. High bounce rates signal list quality issues. Regularly clean your email list to maintain hygiene.

Unsubscribe Rates: The percentage of recipients who opt out. High rates may indicate misaligned content or frequency. Adjust content and sending frequency to match subscriber preferences.

Spam Complaints: The number of recipients marking your email as spam. High rates damage your reputation. Ensure explicit permission, clear unsubscribe options, and avoid misleading content.

Engagement Over Time: Track how engagement metrics change over time to gauge the overall health of your email strategy. Based on engagement data, refine content and design.

Regularly monitoring these metrics helps you make informed decisions and optimize your email campaigns for long-term success.

Set Clear Goals

Setting clear goals is essential for measuring and analyzing your email marketing success. Well-defined goals provide direction and help determine the metrics to track. Clear goals allow you to measure success accurately and identify improvement areas. They serve as benchmarks for evaluating your campaigns and guide your strategy toward specific outcomes.

Steps to Set Clear Goals

  • Specific: Clearly define what you want to achieve, e.g., “Increase open rates by 10% in the next quarter.”
  • Measurable: Quantify your goals using metrics like open and click-through rates.
  • Achievable: Set realistic goals based on current performance.
  • Relevant: Align goals with business objectives, such as increasing sales.
  • Time-bound: Set deadlines, e.g., “Boost “click-through rates by 20% in six months.”
  • Align” with Business Objectives: Ensure goals support broader business aims, such as growing your customer base.
  • Identify Key Performance Indicators (KPIs): Determine metrics to track progress, like open rates and time spent on the landing page.
  • Set Short-Term and Long-Term Goals: Balance immediate improvements with long-term objectives.
  • Communicate Goals Clearly: Ensure the team understands and works towards these goals.
  • Please review and Adjust Regularly: Periodically reassess goals to keep them relevant

By setting clear, specific, and measurable goals, you can effectively measure and analyze your email marketing campaigns and stay focused on achieving tangible results.

Use Analytics Tools

Using analytics tools is essential for measuring and analyzing the success of your email marketing campaigns. These tools provide valuable insights into email performance, helping you make data-driven decisions to optimize your strategy. Analytics tools allow you to track key metrics, understand subscriber behavior, and identify areas for improvement. They provide a detailed view of your campaign performance, enabling informed decisions and enhanced email marketing efforts.

Popular Analytics Tools

Mailchimp: Tracks open rates, click-through rates, and conversion metrics.

HubSpot: Offers advanced analytics and integration with other marketing channels.

ActiveCampaign: Provides robust analytics, including automation and engagement insights.

Integration: Tracks website traffic and conversions from email campaigns.

UTM Parameters: Tags email links for detailed interaction tracking.

Goals and Conversions: Measures specific actions taken by email visitors.

Litmus: Tests and analyzes email design and deliverability.

Email on Acid: Offers spam testing, design previews, and engagement tracking.

How to Use Analytics Tools Effectively

Track Key Metrics: Monitor open rates, CTRs, conversion rates, bounce rates, and unsubscribe rates.

Set Up Automated Reports: Schedule regular updates on campaign performance.

Segment Your Data: Break down data by demographics, behavior, and engagement levels.

Analyze Trends Over Time: Identify long-term trends and patterns.

Test and Optimize: Use A/B testing to experiment and refine your campaigns.

By leveraging analytics tools, you can gain valuable insights into your email marketing performance and continuously improve your campaigns. These email marketing tools are essential for making data-driven decisions and achieving email marketing goals.

Analyze Your Data

Analyzing your data is crucial for understanding your email marketing campaign’s effectiveness. By examining key metrics and trends, you can identify what works and doesn’t work to optimize your strategy. Data analysis enables informed decision-making and continuous improvement. It helps you pinpoint strengths, weaknesses, and opportunities for refinement.

Key Metrics to Analyze

Open Rates: Compare open rates across campaigns to see which subject lines and send times work best.

Click-Through Rates (CTR): Identify which links get the most clicks, indicating engaging content and compelling CTAs.

Conversion Rates: Track actions after clicks, showing how well your emails drive desired actions.

Bounce Rates: Monitor undelivered emails to detect list quality or deliverability issues.

Unsubscribe Rates: Watch for high opt-out rates as a signal that your content or frequency may need adjusting.

Engagement Trends: Analyze changes in metrics over time to assess overall list health and strategy effectiveness.

Steps for Effective Data Analysis

Collect Data Regularly: Use analytics tools to gather and store data consistently.
Compare Performance Across Campaigns: Identify patterns and successful strategies.
Segment Your Data: Demographics, behavior, and engagement levels.
Identify Key Insights: Focus on significant data points and trends.
Make Data-Driven Decisions: Implement changes based on your analysis and monitor the impact.
Iterate and Optimize: Continuously refine your approach for incremental improvements.

By thoroughly analyzing your data, you can drive continuous improvement, achieving better engagement, higher conversion rates, and overall success in your email marketing efforts.

Conduct A/B Testing

A/B testing is a powerful technique for optimizing email marketing campaigns. By comparing two versions of an email, you can make data-driven decisions that enhance engagement and conversion rates.A/B testing helps you understand what elements resonate with your audience. It allows you to test different strategies and refine your approach based on performance data.

Steps to Conduct A/B Testing

  • Define Your Goal: Identify your objectives, such as increasing open rates or conversions.
  • Choose One Variable to Test: Test only one element at a time, like subject lines or CTAs.
  • Create Variations: Develop two versions of your email, differing only in the tested element.
  • Randomly Segment Your Audience: Split your email list into two random segments.
  • Determine Sample Size: Ensure your sample size is large enough for reliable results.
  • Measure Performance: Track key metrics like open rates and click-through rates.
  • Analyze Results: Compare the performance of each version and identify the winner.
  • Implement the Winning Version: Apply the successful version to your broader campaign.
  • Repeat and Iterate: Continuously test new elements and refine your strategy.

By conducting A/B testing, you can fine-tune your email campaigns to meet audience preferences better, leading to higher engagement and conversion rates.

Gather Feedback

Gathering feedback from your audience is crucial for measuring and analyzing the success of your email marketing campaigns. Feedback provides direct insights into subscribers’ needs and pain points, helping you tailor your strategy to meet their expectations better. Feedback lets you understand how your emails are perceived, identifying strengths and weaknesses. This allows you to make informed adjustments to improve engagement and satisfaction.

Methods to Gather Feedback

  • Surveys and Polls: Include links to surveys in your emails or use embedded polls for quick questions.
  • Feedback Forms: Request feedback after purchases or significant interactions.
  • Direct Replies: Encourage subscribers to reply with their thoughts and suggestions.
  • Customer Service Interactions: Analyze input from customer service to identify common issues.
  • Social Media Listening: Monitor social media channels for comments about your emails and brand.

Benefits of Gathering Feedback

  • Enhanced Engagement: Tailor content to audience preferences.
  • Increased Satisfaction: Address concerns and preferences, boosting loyalty.
  • Continuous Improvement: Regular feedback provides insights for ongoing strategy refinement.

By actively gathering and analyzing feedback, you can ensure your email marketing campaigns align with your audience, build stronger relationships, and achieve better results over time.

Adjust and Optimize

Adjusting and optimizing your email marketing campaigns is essential for continuous improvement and better results. Regularly refine your strategy based on data and feedback to enhance engagement, increase conversions, and ensure relevance. Optimization ensures your campaigns remain effective and aligned with your audience’s preferences.

Steps to Adjust and Optimize

  • Review Performance Data: Analyze critical metrics like open rates, CTR, and conversions to identify trends.
  • Implement Changes: Use insights from data and feedback to adjust content, design, and frequency.
  • Test Different Approaches: Conduct A/B testing on subject lines, CTAs, and send times.
  • Personalize Content: Tailor messages to audience segments based on their behaviors and preferences.
  • Optimize for Mobile: Ensure emails are mobile-friendly for better readability and engagement.
  • Enhance Deliverability: Clean your email list regularly and avoid spammy content.
  • Refine Segmentation: Continuously update audience segments for more targeted campaigns.
  • Monitor Competitor Strategies: Learn from competitors and incorporate successful tactics.
  • Update Automation Workflows: Regularly review and improve automated emails.
  • Seek Continuous Feedback: Gather and use subscriber feedback for ongoing improvements.

Benefits of Adjustment and Optimization

  • Improved Engagement: Higher open rates and CTR.
  • Increased Conversions: More effective CTAs.
  • Enhanced Subscriber Satisfaction: Builds trust and loyalty.
  • Higher ROI: More efficient and effective campaigns.

Consistently adjusting and optimizing your email marketing ensures sustained success and growth.

Measuring and analyzing your email marketing success is crucial for refining your strategies and achieving your goals. You can gain valuable insights into your campaign by identifying key metrics, setting clear objectives, using analytics tools, and conducting A/B tests. Gathering feedback and continuously adjusting your emails based on data ensures they remain effective and engaging.

Implementing these best practices helps create targeted, personalized, and successful email campaigns. Email marketing is an ongoing testing, learning, and improving process. By staying committed to these steps, you can enhance your email marketing efforts, foster stronger relationships with your audience, and drive better business results.

Start applying these strategies today to measure and analyze your email marketing success and watch your campaigns thrive.

Email Marketing Essentials: Best Practices for Effective Campaigns

Introduction

Email marketing is one of the most powerful tools for connecting with your audience and driving business growth. It lets you reach your customers directly, providing valuable information, offers, and updates. However, following best practices is essential to maximize your email marketing efforts. This ensures that your campaigns are effective and engaging and deliver the desired results.

This blog will explore the essential best practices for creating successful email marketing campaigns. From understanding your audience to crafting compelling subject lines, personalizing your messages, and analyzing your performance, we’ll cover all the essentials you need to know. Let’s dive in and discover how you can enhance your email marketing strategy and achieve better results.

Understand Your Audience

Understanding your audience is the foundation of any successful email marketing campaign. Knowing who your subscribers are and what they care about allows you to tailor your messages to meet their needs and interests.When you understand your audience, you can create content that resonates with them. This leads to higher engagement rates, increased loyalty, and better overall campaign performance. By speaking directly to the interests and needs of your subscribers, you build trust and foster long-term relationships.

How to Identify Your Audience

To identify your email marketing audience, gather direct insights through surveys and feedback to understand preferences and pain points.Analyzing customer data to uncover demographics,buying behaviors, and purchase history Create detailed customer personas to capture fundamental interests and motivations. Use segmentation to divide your email list into targeted groups based on demographics, behavior, and preferences. This approach ensures your email marketing is personalized, relevant, engaging, and converting to your audience.

  • Surveys and Feedback: Conduct surveys and ask for feedback to gain insights into your audience’s preferences, needs, and pain points. This direct input is invaluable for tailoring your content.
  • Customer Data: Analyze existing customer data to understand demographics, buying behaviour, and interaction patterns. Look at metrics such as age, gender, location, purchase history, and website activity.
  • Create Customer Personas: Develop detailed personas representing different segments of your audience. These personas should include demographic information, interests, challenges, and motivations.
  • Segmentation: Segmentation divides your email list into smaller, more targeted groups based on specific criteria. This allows you to send more relevant and personalized content to each group.
    • Demographics: Segment by age, gender, income, location, etc.
    • Behavior: Group subscribers based on past behavior, such as purchase history or email engagement.
    • Preferences: Use preferences subscribers indicate to tailor your content, such as interests or product preferences.

By understanding your audience and effectively segmenting your email list, you can ensure your messages are relevant and engaging. This improves open and click-through rates and fosters stronger connections with your subscribers.

Craft Compelling Subject Lines

Crafting compelling subject lines is crucial for the success of your email marketing campaigns. The subject line is the first thing your recipients see, significantly affecting whether they open your email.A well-crafted subject line grabs attention and piques curiosity, leading to higher open rates. It sets the tone for the content inside and can significantly impact the effectiveness of your email marketing efforts.

Best Practices for Crafting Subject Lines

  • Keep It Short and Clear: Aim for a concise and to-the-point subject line. Ideally, it should be around 40-50 characters to ensure it’s evident on mobile devices.
  • Use Action-Oriented Language: Encourage your recipients to take action by using solid and actionable verbs. For example, “Unlock Your Special Discount” or “Discover the Latest Trends.”
  • Personalize When Possible: Adding the recipient’s name or other personal details can make the subject line more relevant and engaging. For instance, “John, Don’t Miss Your Exclusive Offer!”
  • Create a Sense of Urgency: Phrases like “Limited Time Offer” or “Only a Few Left” can create a sense of urgency, prompting recipients to open the email immediately.
  • Avoid Spammy Words: Avoid words that might trigger spam filters, such as “Free,” “Buy Now,” or excessive punctuation and capitalization.
  • Test Different Approaches: Use A/B testing to experiment with different subject lines. This helps you understand what resonates best with your audience and refine your approach.

Following these best practices, you can craft subject lines that capture attention and encourage recipients to open your emails. Effective subject lines are a vital component of successful email marketing campaigns, helping to increase engagement and drive better results.

Personalize Your Emails

Personalizing your emails is essential for creating a solid connection with your audience and improving engagement. Personalized emails show your subscribers that you understand their preferences and needs, making them more likely to respond positively to your messages.Personalized emails can lead to higher open rates, click-through rates, and conversions. They make your subscribers feel valued and recognized, fostering loyalty and trust. By delivering relevant content, you enhance the overall customer experience.

Techniques for Personalizing Your Emails

  • Use the Recipient’s Name: Addressing your subscribers by their name in the subject line or greeting can make your emails feel more personal and engaging. For example, “Hi Sarah, Here’s Your Special Offer!”
  • Tailor Content to Individual Preferences: Customize the content of your emails based on the recipient’s preferences, behavior, or past interactions. Send them related offers or updates if a subscriber is interested in a specific product category.
  • Dynamic Content: Implement dynamic content blocks that change based on the recipient’s data. For example, display different images, offers, or messages to different audience segments within the same email.
  • Behavior-Based Triggers: Set up automated emails triggered by specific actions, such as browsing behavior, past purchases, or cart abandonment. This ensures that your emails are timely and relevant to the recipient’s interests.
  • Personalized Recommendations: Use data on past purchases or browsing history to suggest products or services the recipient might be interested in. For example, “We thought you might like these new arrivals.”
  • Anniversary and Birthday Emails: Send special emails to celebrate important dates like anniversaries or birthdays. These emails can include personalized messages and exclusive offers, making your subscribers feel special.

Benefits of Personalization

  • Increased Engagement: Personalized emails are likelier to be opened and clicked, leading to higher engagement rates.
  • Improved Customer Experience: By delivering relevant and timely content, you enhance the overall experience for your subscribers.
  • Higher Conversion Rates: Personalized offers and recommendations can increase conversions and sales.
  • Enhanced Loyalty: Showing you understand and value your subscribers fosters long-term loyalty and trust.

By implementing these personalization techniques, you can create more engaging and effective email marketing campaigns that resonate with your audience and drive better results. Personalization is a powerful tool that can significantly enhance your email marketing strategy.

Design for All Devices

Designing your emails to be compatible with all devices is crucial for ensuring that your messages are accessible and visually appealing to every recipient, regardless of how they access their email. With the growing use of smartphones and tablets, your emails must look great on any screen size.A significant portion of your audience will open your emails on mobile devices. If your emails are optimized for mobile, you can avoid losing engagement and conversions due to poor user experience. Ensuring that your emails are mobile-friendly can significantly enhance readability and interaction rates.

Best Practices for Designing Emails for All Devices

  • Responsive Design: Use techniques to ensure your email layout adjusts to fit any screen size. Your email will look good whether viewed on a desktop, tablet, or smartphone.
  • Single-Column Layout: A single-column layout is more mobile-friendly and easily read on smaller screens. It also helps to keep the design simple and uncluttered.
  • Readable Fonts: Use a font size that is easy to read on small screens. Generally, a minimum of 14px for body text is recommended. Avoid overly decorative fonts that might be hard to read on mobile devices.
  • Touch-Friendly Buttons: Ensure that any buttons or links in your email are large enough to be easily tapped on a touchscreen. A minimum button size of 44×44 pixels is a good guideline.
  • Concise Content: Keep your content concise and to the point. Mobile users often scan emails, so make sure your main message and call to action are immediately apparent.
  • Optimized Images: Use images that load quickly and look good on all devices. Ensure that your pictures are manageable, which can slow down loading times, and always include alt text for images in case they load correctly.
  • Testing: Always test your emails on multiple devices and email clients to ensure they display correctly everywhere. Tools like Litmus or Email on Acid can help you see how your emails look on different screens and platforms.

Following these best practices, you can design emails that provide a seamless experience across all devices. This improves the user experience and enhances engagement and conversion rates. Ensuring your emails are accessible and visually appealing on any device is critical to effective email marketing.

Create Engaging Content

Creating engaging content is essential for capturing your audience’s attention and encouraging them to interact with your emails. High-quality content keeps your subscribers interested and helps build a strong relationship with them.Engaging content drives higher open rates, click-through rates, and conversions. It ensures that your emails are not only read but also acted upon. When your content resonates with your audience, they trust your brand and take the desired actions.

Best Practices for Creating Engaging Content

  • Value-Driven Content: Focus on providing content that is valuable to your audience. This could be informative articles, helpful tips, exclusive offers, or entertaining stories. Always ask yourself how your content can benefit your readers.
  • Clear and Concise Messaging: Keep your messages clear and to the point. Avoid long paragraphs and complicated language. Use bullet points and subheadings to make your content easy to scan.
  • Strong Call to Action (CTA): Every email should have a clear and compelling CTA. Whether you want your readers to visit your website, purchase a product, or download a resource, make sure the CTA stands out and is easy to follow.
  • Visual Elements: Use images, videos, and infographics to make your emails visually appealing. Visual content can break up text and make your emails more engaging. Ensure all visual elements are optimized for fast loading and display well on all devices.
  • Personalization: Tailor your content to your subscribers’ individual preferences and behaviors. Personalized content feels more relevant and can significantly increase engagement.
  • Interactive Elements: To encourage reader interaction, include interactive elements such as polls, quizzes, or clickable images. Interactive content can make your emails more engaging and fun.
  • Consistent Branding: Maintain a consistent brand voice and style across all your emails. This helps build brand recognition and trust. Use your brand colors, fonts, and logo to create a cohesive look.
  • Relevant Content: Ensure your content applies to your audience’s interests and needs. Use segmentation to send targeted messages likely to resonate with different groups of subscribers.

Types of Engaging Content

  • Educational Content: Share how-to guides, tips, and industry insights that help your audience solve problems or learn something new.
  • Promotional Content: Offer exclusive deals, discounts, and promotions to incentivize action.
  • Storytelling: Share stories about your brand, customers, or employees to create a personal connection.
  • User-Generated Content: Feature testimonials, reviews, and content your customers create to build trust and authenticity.

By following these best practices, you can create content that engages your audience and drives action. Engaging content is at the heart of successful email marketing campaigns, helping you build lasting relationships and achieve your marketing goals.

Implement Automation

Implementing automation in your email marketing campaigns can significantly enhance efficiency and effectiveness. Automation allows you to send the right message to the right person at the right time without manual effort.Automation saves time and ensures consistency in your email marketing efforts. It helps you nurture leads, engage with your audience, and drive conversions by delivering personalized and timely messages.

Best Practices for Implementing Automation

  • Welcome Series: Set up an automated welcome series to greet new subscribers. Introduce your brand, share valuable resources, and guide them on what to expect from your emails.
  • Drip Campaigns: Create drip campaigns to nurture leads over time. Drip campaigns consist of emails sent at specific intervals, providing valuable content and gradually leading the subscriber toward a purchase or other desired action.
  • Behavioral Triggers: Use behavioral triggers to send emails based on subscriber actions. For example, send a follow-up email when someone clicks a link in your email, visits a specific page on your website, or abandons their shopping cart.
  • Re-engagement Emails: Set up automated re-engagement emails to reconnect with inactive subscribers. Offer them incentives to come back, such as exclusive discounts or new content they might be interested in.
  • Birthday and Anniversary Emails: Send automated birthday or anniversary emails to celebrate special occasions. These personal touches can enhance customer loyalty and engagement.
  • Post-Purchase Follow-Up: Automate follow-up emails after a purchase. Thank the customer, offer related product recommendations, and ask for feedback or reviews.

Popular Automation Tools

  • Mailchimp: Offers a user-friendly platform with powerful automation features, including welcome series, abandoned cart emails, and more.
  • ActiveCampaign: Provides advanced automation capabilities focusing on customer journeys and behavioral triggers.
  • HubSpot: Combines email marketing with CRM features, allowing for highly personalized and automated workflows.
  • SendinBlue: Known for its robust automation features and affordability, it is ideal for businesses of all sizes.

Benefits of Automation

  • Increased Efficiency: Automation saves time by handling repetitive tasks, allowing you to focus on strategy and creative work.
  • Consistency: Ensures emails are sent consistently and on time, improving overall campaign reliability.
  • Personalization: Delivers personalized content based on subscriber behavior and preferences, enhancing engagement.
  • Scalability: Easily scales with your business, allowing you to manage growing subscriber lists and complex workflows without extra effort.
  • Improved Engagement: Timely and relevant automated emails can increase open rates, click-through rates, and conversions.

By implementing automation in your email marketing strategy, you can enhance the effectiveness of your campaigns, build stronger relationships with your audience, and drive better results with less effort. Automation is a powerful tool that can take your email marketing to the next level.

A/B Testing

A/B testing is a crucial practice in email marketing that helps you determine what elements of your emails are most effective. By comparing two versions of an email to see which one performs better, you can optimize your campaigns for higher engagement and conversions.

A/B testing allows you to make data-driven decisions and continuously improve your email marketing strategy. Understanding what works best for your audience can increase open rates, click-through rates, and overall campaign effectiveness.

Best Practices for A/B Testing

  • Test One Element at a Time: To accurately determine what impacts performance, test only one variable at a time. This could be the subject line, CTA, email layout, images, or copy.
  • Define Clear Goals: Establish what you want to achieve with your test. Are you looking to increase open rates, click-through rates, or conversions? Clear goals help you measure success accurately.
  • Create Variations: Develop two versions of your email, each with a single different element. For example, if you are testing subject lines, keep the email content the same in both versions.
  • Random Sampling: Ensure your test groups are randomly selected and large enough to provide statistically significant results. This avoids bias and ensures reliable data.
  • Monitor and Analyze Results: Track the performance of each variation using key metrics relevant to your goals. Compare open, click-through, and conversion rates to determine the winning version.
  • Implement the Winning Version: Once you have identified the better-performing version, use it as your standard. Apply the insights gained from the test to future emails.
  • Continuous Testing: A/B testing is not a one-time activity. Continually test new elements to keep improving your email marketing campaigns.

What to Test

  • Subject Lines: Experiment with different lengths, tones, and styles. Test personalization, emojis, and urgency.
  • Call to Action (CTA): Try different wording, colors, and placements to see what drives more clicks.
  • Email Layout: Test single-column vs. multi-column layouts and different image and text placements.
  • Content: Compare long-form content with short-form content and test different types of messaging or offers.
  • Send Times: Experiment with different days of the week and times of day to find the optimal time to reach your audience.

Benefits of A/B Testing

  • Improved Engagement: Discover what resonates best with your audience, leading to higher open and click-through rates.
  • Better Conversion Rates: Optimize elements that drive conversions, increasing your overall ROI.
  • Informed Decisions: Make data-driven decisions rather than relying on guesswork or assumptions.
  • Continuous Improvement: Regular testing and optimization lead to ongoing improvements in your email marketing strategy.

Implementing A/B testing in your email marketing campaigns can help you fine-tune your approach and achieve better results. It’s a powerful tool that enables you to understand your audience’s preferences and optimize your emails for maximum impact.

Monitor and Analyze Performance

Monitoring and analyzing the performance of your email marketing campaigns is essential for understanding what works and what doesn’t. You can make informed decisions and continuously improve your strategies by tracking critical metrics.Regularly reviewing your email campaign performance helps you identify strengths and weaknesses. It allows you to optimize your efforts, increase engagement, and achieve better results over time.

Key Metrics to Track

  • Open Rates: The percentage of recipients who open your email. A higher open rate indicates effective subject lines and a good sender reputation.
  • Click-Through Rates (CTR): The percentage of recipients clicking links within your email. This shows how engaging and relevant your content is.
  • Conversion Rates: The percentage of recipients completing the desired action, such as purchasing or filling out a form. This metric measures the overall effectiveness of your email in driving action.
  • Bounce Rates: The percentage of emails that could not be delivered. High bounce rates can indicate issues with your email list quality or problems with email deliverability.
  • Unsubscribe Rates: The percentage of recipients who opt out of your email list. While some unsubscribes are expected, a high rate may signal that your content needs to meet subscriber expectations.

Tools for Analytics

  • Email Marketing Platforms: Most email marketing tools, such as Mailchimp, ActiveCampaign, and HubSpot, provide built-in analytics to track these key metrics.
  • Google Analytics: Use Google Analytics to track traffic and conversions from your email campaigns to your website.
  • Third-Party Tools: Platforms like Litmus and Email on Acid offer additional insights and testing capabilities to optimize your emails.

Best Practices for Monitoring and Analysis

  • Set Clear Goals: Define what success looks like for each campaign. This could be increased sales, higher engagement, or growing your subscriber list.
  • Regular Reporting: Create reports to review your metrics and track progress. Identify trends and patterns that can inform future campaigns.
  • Benchmarking: Compare your performance against industry benchmarks to understand how your campaigns stack up. This can provide context for your metrics and highlight areas for improvement.
  • A/B Testing Results: Analyze the outcomes of your A/B tests to identify which elements drive better performance and apply these insights to future emails.
  • Feedback Loop: Use the data you gather to create a feedback loop. Continuously refine and adjust your strategies based on the metrics findings.

Benefits of Monitoring and Analysis

  • Data-Driven Decisions: Make informed decisions based on concrete data rather than assumptions.
  • Identify Areas for Improvement: Understand where your campaigns may need to catch up and how to address these issues.
  • Optimize Campaigns: Use insights to refine your content, design, and strategy for better results.
  • Enhanced Engagement: By understanding your audience’s response, you can create more engaging and effective emails.
  • Increased ROI: Continuous optimization leads to better performance, driving higher returns on your email marketing investment.

By consistently monitoring and analyzing your email marketing performance, you can ensure that your campaigns are effective and continuously improving. This process is critical to maximizing the impact of your email marketing efforts.

Ensure Compliance

Ensuring compliance with email marketing regulations is crucial for protecting your business and maintaining the trust of your subscribers. Adhering to legal requirements helps avoid penalties and ensures recipients welcome your emails.Compliance with email marketing laws is essential for building trust with your audience and avoiding legal issues. It demonstrates your commitment to respecting subscriber privacy and following best practices.

Key Regulations to Follow

To ensure compliance in email marketing, it is essential to adhere to several critical regulations designed to protect consumers and promote ethical marketing practices. Understanding and implementing these rules can help build trust with your audience and protect your business from legal repercussions. Here are the primary regulations you should follow:

CAN-SPAM Act (United States)

The CAN-SPAM Act sets the standards for commercial emails in the United States. Key requirements include:

  • Opt-Out Mechanism: Every email must consist of a straightforward way for recipients to opt out of receiving future emails. This opt-out mechanism should be concisely honored promptly, typically within ten business days.
  • No Deceptive Subject Lines: Subject lines should accurately reflect the content of the email. Misleading subject lines are prohibited.
  • Identify the message as an Advertisement: If the email is an advertisement, it must be disclosed.
  • Include Your Physical Address: The sender’s valid physical postal address must be included in each email.
  • Honor Opt-Out Requests Promptly: Any opt-out requests must be processed quickly to ensure compliance with the law.

GDPR (General Data Protection Regulation – European Union)

The GDPR is a comprehensive regulation that governs data protection and privacy for individuals within the European Union. Key aspects include:

  • Consent: Before sending emails, obtain explicit consent from recipients. This consent must be freely given, specific, informed, and unambiguous.
  • Data Protection: Personal data must be stored securely and processed lawfully. Companies must take appropriate measures to protect the data they handle.
  • Right to Access and Erasure: Recipients can access their data and request its deletion anytime.
  • Transparency: Inform recipients about how their data will be used. This includes providing details on data collection, processing, and storage.
  • Breach Notification: Data protection authorities must be notified within 72 hours of a data breach.

CASL (Canada’s Anti-Spam Legislation)

CASL is one of Canada’s strictest anti-spam laws and governs email marketing. Key points include:

  • Consent: Obtain express or implied permission from recipients before sending commercial emails. Express consent involves an explicit agreement, while implied consent can occur through existing business relationships.
  • Identification: Identify yourself and provide contact information in every email. This ensures transparency and builds trust with recipients.
  • Unsubscribe Mechanism: Include a straightforward way for recipients to unsubscribe from future emails. Unsubscribe requests must be processed quickly and efficiently.

PECR (Privacy and Electronic Communications Regulations – United Kingdom)

PECR complements the GDPR in the UK by providing specific rules for electronic communications. Important requirements are:

  • Consent: Obtain consent before sending unsolicited marketing emails. This is essential to ensure that recipients welcome communications.
  • Transparency: Inform recipients about who you are and how they can contact you. This helps build credibility and trust.
  • Unsubscribe Option: Provide a precise mechanism for opting out of future communications, ensuring recipients can easily withdraw their consent.

Australia’s Spam Act 2003

Australia’s Spam Act regulates commercial electronic messages. Key regulations include:

  • Consent: Ensure you have permission before sending marketing emails. This consent can be expressed or inferred based on prior relationships.
  • Identify Yourself: Include clear identification and contact details in every email. Transparency is crucial for maintaining trust.
  • Unsubscribe: Provide a functional unsubscribe facility and honor opt-out requests promptly to ensure recipients can easily opt out of future communications.

Best Practices for Compliance

  • Obtain Explicit Consent: Always get permission from individuals before adding them to your email list. Use double opt-in methods where subscribers confirm their subscription via email.
  • Provide Clear Opt-Out Options: Every email should include a visible and easy-to-use unsubscribe link. Ensure that opt-out requests are processed promptly and without complications.
  • Accurate Sender Information: Ensure your emails identify your business and provide a valid physical address. This builds trust and transparency with your audience.
  • Honest Subject Lines: Avoid misleading or deceptive subject lines. Ensure that the subject line accurately reflects the content of the email.
  • Protect Subscriber Data: Implement robust data protection measures to safeguard subscriber information. Ensure that your data collection and storage practices comply with relevant regulations.
  • Regularly Update Your List: Clean your email list regularly to remove inactive or invalid email addresses. This helps maintain a high sender reputation and reduces the risk of deliverability issues.
  • Document Compliance Efforts: Keep records of consent, unsubscribe requests, and data protection practices. This documentation can be helpful if you ever need to demonstrate compliance.

Benefits of Compliance

  • Builds Trust: Compliance shows that you respect your subscribers’ privacy and choices, helping to build trust and loyalty.
  • Avoids Penalties: Adhering to regulations helps prevent costly fines and legal issues associated with non-compliance.
  • Improves Deliverability: Compliant practices reduce the likelihood of your emails being marked as spam, improving deliverability rates.
  • Enhances Reputation: A strong reputation for compliance and respect for subscriber preferences enhances your brand image and credibility.

Ensuring compliance with email marketing regulations can protect your business, build trust with your audience, and maintain a positive reputation. Compliance is a crucial aspect of practical and ethical email marketing.

Effective email marketing requires a strategic approach and adherence to best practices. You can significantly enhance your email marketing campaigns by understanding your audience, crafting compelling subject lines, personalizing your emails, designing for all devices, creating engaging content, implementing automation, conducting A/B testing, monitoring performance, and ensuring compliance.

These practices improve engagement and conversion rates and build trust and long-term relationships with your subscribers. Continuously refining your email marketing strategy based on data and feedback will help you stay ahead in the competitive email marketing landscape.

Start applying these best practices today to elevate your email marketing efforts and achieve better results. With a thoughtful and well-executed approach, you can turn your email campaigns into powerful tools for business growth and customer engagement.

10 ways to Minimize Main Thread Work to Improve Core Web Vitals

What is Main Thread Work?

Main thread work refers to the tasks that the browser’s main thread handles to make a web page work properly. Think of the main thread as the browser’s control center. It does important jobs like:

  • Processing HTML and CSS: Building the page structure and style.
  • Running JavaScript: Adding interactive features and fetching data.
  • Rendering: Drawing the page on the screen and handling animations.
  • Handling User Actions: Responding to clicks, taps, and scrolls.

When the main thread is busy, the website can feel slow and unresponsive. Reducing the work on the main thread helps make websites faster and more user-friendly. This is important for a better user experience and improved performance metrics like Core Web Vitals.

Why is Minimizing Main Thread Work Important?

Minimizing main thread work is crucial for improving the performance and user experience of a website. When the main thread is overloaded, it struggles to keep up with tasks like rendering the page, running scripts, and responding to user interactions. This can make the website feel slow and unresponsive.

Improves User Experience

A smooth and responsive website keeps users happy. When the main thread isn’t bogged down with too many tasks, it can quickly respond to clicks, taps, and other interactions. This makes the website feel faster and more enjoyable to use. Users are more likely to stay on a site that feels responsive and doesn’t lag.

Boosts Performance Metrics

Core Web Vitals are a set of performance metrics that Google uses to measure the quality of user experience on a webpage. These include Largest Contentful Paint (LCP), First Input Delay (FID), and Cumulative Layout Shift (CLS). When you minimize main thread work, you improve these metrics. For example, less main thread work can lead to a lower FID, meaning the page responds faster to user input.

Enhances SEO

Google considers performance metrics like Core Web Vitals in its search rankings. A website that performs well and offers a good user experience can rank higher in search results. This means more visibility and more traffic to your site. By minimizing main thread work, you not only improve the user experience but also boost your site’s SEO.

Ways to Minimize Main Thread Work 

Optimize JavaScript Execution

Optimizing JavaScript execution is one of the most effective ways to minimize main thread work and improve your website’s Core Web Vitals. JavaScript can significantly impact the performance of a webpage because it requires processing power from the main thread. When you optimize how JavaScript is handled, you reduce the load on the main thread, making your site faster and more responsive.

Code Splitting

Code splitting is a technique that breaks down your JavaScript code into smaller chunks. Instead of loading a large JavaScript file all at once, the browser only loads the code needed for the initial page load. Additional code is loaded as needed. This reduces the initial load time and helps the main thread handle tasks more efficiently. Tools like Webpack can help you implement code splitting in your projects.

Tree Shaking

Tree shaking removes unused code from your JavaScript files. When you import libraries, not all parts of the library might be necessary for your project. Tree shaking identifies and eliminates this unnecessary code, reducing the overall size of your JavaScript files. Smaller files mean less work for the main thread, leading to faster execution and better performance.

Defer Non-Critical JavaScript

Using the async and defer attributes on script tags can defer the loading and execution of non-critical JavaScript. The async attribute allows the script to download in the background while the page continues to load. Once the script is downloaded, it executes immediately. The defer attribute also allows background downloading but ensures the script executes only after the HTML document is fully parsed. This approach prevents JavaScript from blocking the initial rendering of the page, improving load times and reducing main thread work.

Minify JavaScript

Minifying JavaScript involves removing unnecessary characters, such as spaces and comments, without changing its functionality. Minified code is smaller in size, which means the browser can download and execute it faster. Tools like UglifyJS and Terser can automate the minification process, helping you optimize your JavaScript with minimal effort.

Avoid Long-Running JavaScript

Long-running JavaScript tasks can monopolize the main thread, causing delays in rendering and responding to user input. Break down long tasks into smaller, asynchronous tasks using techniques like requestIdleCallback or setTimeout. This approach allows the browser to handle other critical tasks in between, improving overall performance and responsiveness.

Defer Non-Critical JavaScript

Deferring non-critical JavaScript is an effective method to minimize main thread work and improve Core Web Vitals. When you defer JavaScript that isn’t essential for the initial load, you allow the browser to focus on rendering the page quickly and efficiently. This approach helps ensure that users see the content faster and can interact with the page without delay.

Using async and defer Attributes

The async and defer attributes are tools that let you control how and when JavaScript is loaded and executed.

  • Async Attribute: When you add the async attribute to a script tag, the browser downloads the script while it continues to process the HTML. Once the script is downloaded, it executes immediately. This is useful for scripts that are independent and don’t rely on other scripts or the HTML structure.
  • Defer Attribute: The defer attribute works similarly by downloading the script while the HTML is being processed. However, it ensures that the script only executes after the HTML is fully parsed. This makes it ideal for scripts that need to interact with the DOM.

Using these attributes, you can prevent non-critical JavaScript from blocking the rendering of your webpage. For example, analytics scripts, social media widgets, and other third-party integrations are often non-critical and can be deferred. This way, the browser can prioritize rendering the essential content that users need to see first.

By deferring non-critical JavaScript, you reduce the load on the main thread during the initial page load. This leads to faster rendering times and a better user experience. Users can start interacting with the page sooner, and important performance metrics like First Input Delay (FID) and Largest Contentful Paint (LCP) improve.

Reduce JavaScript Payloads

Reducing JavaScript payloads is crucial for minimizing main thread work and improving your website’s Core Web Vitals. Large JavaScript files can slow down your site by increasing load times and adding more work for the main thread to process. By reducing the size of your JavaScript files, you can make your website faster and more responsive.

Minify JavaScript

Minifying JavaScript means removing unnecessary characters like spaces, comments, and line breaks from your code. This process reduces the file size without changing the code’s functionality. Smaller files load faster and put less strain on the main thread. Tools like UglifyJS and Terser can automate this process, making it easy to implement.

Avoid Long-Running JavaScript

Long-running JavaScript tasks can block the main thread, making your site feel slow and unresponsive. Breaking these tasks into smaller, asynchronous chunks can help. Use techniques like requestIdleCallback or setTimeout to split up long tasks. This approach lets the browser handle other important tasks between chunks, improving overall performance.

Optimize CSS

Optimizing CSS is essential for minimizing main thread work and improving Core Web Vitals. CSS (Cascading Style Sheets) determines the look and feel of your website, but if not managed properly, it can significantly slow down the rendering process. By optimizing CSS, you can enhance your site’s performance and provide a better user experience.

Minimize CSS Complexity

Minimizing CSS complexity means simplifying your stylesheets. Large, complex CSS files take longer to process, increasing the load on the main thread. You can reduce complexity by removing unused CSS rules, combining similar styles, and avoiding overly specific selectors. Tools like PurgeCSS can help identify and remove unused CSS, making your files smaller and faster to load.

Critical CSS

Critical CSS involves inlining the CSS needed for the initial view of the page directly in the HTML. This practice ensures that the essential styles are loaded and applied as soon as possible, reducing render-blocking and improving load times. The rest of the CSS can be loaded asynchronously. This approach helps the main thread render the initial content faster, improving metrics like Largest Contentful Paint (LCP).

Use Web Workers

Using Web Workers is a powerful way to minimize main thread work and improve Core Web Vitals. Web Workers allow you to run scripts in background threads, separate from the main thread. This means that heavy computational tasks don’t block the main thread, keeping your website responsive and fast.

Offloading Heavy Computations

Web Workers are ideal for handling tasks that require significant processing power, such as data processing, complex calculations, or handling large datasets. By offloading these tasks to Web Workers, you free up the main thread to focus on rendering the page and responding to user interactions.

For example, if your website needs to process a large amount of data or perform complex calculations, you can move these operations to a Web Worker. The Web Worker performs the tasks in the background, and when it finishes, it sends the results back to the main thread. This way, the main thread remains available to handle user inputs and render updates quickly.

Using Web Workers can significantly enhance the performance of your site, especially for web applications that rely on heavy computations. This leads to a smoother and more responsive user experience, improving metrics like First Input Delay (FID).

Reduce Layout Thrashing

Reducing layout thrashing is essential for improving Core Web Vitals. Layout thrashing happens when the browser has to repeatedly calculate the layout of a page due to changes in the DOM. This can slow down your site and make it less responsive. Here’s how you can reduce layout thrashing:

Avoid Forced Synchronous Layouts

Forced synchronous layouts occur when you read layout properties (like offsetHeight) immediately after modifying the DOM. This forces the browser to recalculate the layout, which takes time and can cause jank. To avoid this, batch your DOM reads and writes separately. For example, read all necessary properties first, then apply all changes afterward. This minimizes the number of layout recalculations.

Use Efficient CSS

Efficient CSS means writing styles that don’t trigger unnecessary layout calculations. Avoid using CSS properties that require intensive calculations, like complex animations or transitions. Simplify your stylesheets and ensure they are optimized to reduce the impact on layout recalculations.

Minimize Layout-Triggering JavaScript

JavaScript that frequently changes the DOM can cause layout thrashing. Minimize these changes by grouping them together or using techniques like requestAnimationFrame to batch updates. This allows the browser to handle the changes more efficiently and reduces the need for repeated layout calculations.

Debounce and Throttle Event Handlers

Event handlers that trigger frequently, like scroll or resize events, can cause layout thrashing if they involve DOM reads and writes. Use debounce and throttle techniques to limit the frequency of these handlers. This ensures that layout recalculations happen less often and the main thread isn’t overloaded.

Use CSS Transforms for Animations

When creating animations, prefer using CSS transforms (like translate, scale, rotate) instead of properties that trigger layout recalculations (like top, left, width, height). CSS transforms are handled by the GPU, which is more efficient and doesn’t cause layout thrashing.

Lazy Load Images and Videos

Lazy loading images and videos is a smart way to minimize main thread work and improve your website’s Core Web Vitals. By deferring the loading of non-essential media, you ensure that the main thread can focus on rendering critical content first. This makes your site load faster and improves user experience.

Deferring Off-Screen Content

Lazy loading involves loading images and videos only when they are about to enter the viewport (the visible part of the web page). Instead of loading all media files as soon as the page loads, lazy loading ensures that only the necessary content is fetched initially. This reduces the initial load time and decreases the workload on the main thread.

For example, if your webpage has several images and videos that are not immediately visible, you can set them to load only when the user scrolls down to that part of the page. This is achieved by using the loading=”lazy” attribute in the HTML img and iframe tags, or by using JavaScript libraries like LazyLoad.

Lazy loading significantly reduces the amount of data the browser needs to process during the initial load. This not only speeds up the page rendering but also helps in conserving the user’s bandwidth, especially important for mobile users. With less data to handle initially, the main thread can render the essential content more quickly, improving metrics like Largest Contentful Paint (LCP).

Optimize Third-Party Scripts

Optimizing third-party scripts is crucial for minimizing main thread work and improving your website’s Core Web Vitals. Third-party scripts, such as ads, analytics, and social media widgets, can significantly impact your site’s performance. By managing these scripts effectively, you can reduce their load on the main thread and enhance user experience.

Minimizing Impact of Third-Party Resources

Third-party scripts often come from external sources and can introduce performance bottlenecks. Here are some strategies to optimize their impact:

Identify Essential Third-Party Scripts: Not all third-party scripts are crucial for your website. Identify which scripts are essential for your site’s functionality and user experience. Remove any scripts that are not providing significant value.

Load Scripts Asynchronously: Use the async or defer attributes to load third-party scripts without blocking the rendering of your page. The async attribute allows the script to download while the HTML continues to parse, executing the script as soon as it finishes downloading. The defer attribute also allows the script to download while parsing but ensures the script executes only after the HTML is fully parsed.

Use Preconnect and DNS Prefetch: Use the rel=”preconnect” and rel=”dns-prefetch” link attributes to establish early connections to third-party domains. This reduces the time it takes to fetch the scripts when they are needed, speeding up the overall load time.

Bundle Third-Party Scripts: Where possible, bundle multiple third-party scripts together. This reduces the number of HTTP requests, which can speed up loading times.

Load Third-Party Scripts Later: Defer the loading of non-critical third-party scripts until after the main content has loaded. This ensures that the critical rendering path is not blocked by scripts that are not immediately needed.

Monitor Script Performance: Continuously monitor the performance impact of third-party scripts. Use tools like Lighthouse or Chrome DevTools to identify slow or blocking scripts and take action to optimize them.

By implementing these strategies, you can significantly reduce the negative impact of third-party scripts on your website’s performance. This optimization helps ensure that the main thread is not overloaded, leading to faster load times and a smoother user experience.

Efficiently Handle Event Listeners

Efficiently handling event listeners is a key strategy to minimize main thread work and improve your website’s Core Web Vitals. Event listeners respond to user actions like clicks, scrolls, and keyboard inputs. If not managed well, they can create performance bottlenecks, slowing down your site. By optimizing how event listeners are used, you can ensure a smoother, more responsive user experience.

Debouncing and Throttling

Debouncing and throttling are techniques to control the rate at which event handlers are executed.

Debouncing: This technique ensures that an event handler is invoked only after a specified period of inactivity. For example, if a user is typing in a search box, debouncing can delay the search function until the user stops typing for a few milliseconds. This reduces the number of times the search function runs, saving main thread resources.

Throttling: Throttling limits the number of times an event handler can be executed within a certain time frame. For example, when a user is scrolling, throttling ensures that the scroll event handler runs at most once every few milliseconds. This prevents the handler from executing too frequently and overloading the main thread.

Passive Event Listeners

Using passive event listeners can improve scrolling performance. When you add a passive event listener, you inform the browser that the event handler will not call preventDefault(). This allows the browser to perform optimizations for better performance.

To add a passive event listener, set the passive option to true:

javascript

window.addEventListener('scroll', handleScroll, { passive: true });

Unregister Unnecessary Event Listeners

Remove event listeners that are no longer needed to free up resources. For example, if a particular feature or element is no longer visible or relevant, unregister its event listeners to reduce the load on the main thread.

Optimize Event Handler Code

Ensure that the code inside your event handlers is optimized and efficient. Avoid heavy computations and complex operations within event handlers. If necessary, use techniques like requestAnimationFrame for smoother animations and updates.

Preload Key Requests

Preloading key requests is an effective way to minimize main thread work and improve your website’s Core Web Vitals. Preloading helps ensure that critical resources are available as soon as they are needed, reducing load times and enhancing user experience.

Prioritizing Important Resources

Preloading involves telling the browser to fetch important resources early, before they are needed. This can include CSS files, JavaScript files, fonts, and images that are essential for rendering the initial view of the webpage. By preloading these resources, you can ensure they are available immediately, speeding up the rendering process and reducing the time the main thread spends waiting for these resources.

To preload a resource, you can use the <link rel=”preload”> tag in your HTML. For example, to preload a CSS file, you would add the following line to your HTML <head> section:

html

<link rel="preload" href="styles.css" as="style">

This tells the browser to fetch the styles.css file early, so it’s ready when needed.

Improving Largest Contentful Paint (LCP)

Preloading key resources can significantly improve the Largest Contentful Paint (LCP) metric. LCP measures how long it takes for the largest visible content element to load on the screen. By preloading the resources required to render this element, you can reduce the LCP time, making the page appear faster to users.

Reducing Render-Blocking

Preloading helps reduce render-blocking, which occurs when the browser has to wait for critical resources to download before it can render the page. When you preload these resources, you ensure they are available when the browser needs them, reducing the time spent on render-blocking tasks.

Using as Attribute

When preloading resources, it’s important to use the correct as attribute value to specify the type of resource being preloaded. This helps the browser prioritize and handle the resource appropriately. For example:

  • Use as=”style” for CSS files.
  • Use as=”script” for JavaScript files.
  • Use as=”font” for web fonts.

Preconnect to Important Origins

In addition to preloading, you can use the rel=”preconnect” attribute to establish early connections to important origins. This reduces the time needed to set up connections when resources are fetched, further speeding up the loading process.

For example:

html

<link rel="preconnect" href="https://example.com">

In summary, preloading key requests is a powerful technique for improving Core Web Vitals. By prioritizing important resources, reducing render-blocking, and using the correct as attribute, you can ensure a faster, smoother loading experience for users. This leads to better performance metrics and a more responsive website.

How to avoid chaining critical requests.

Understanding Chaining Critical Requests

Chaining critical requests happens when your website makes several dependent network requests to load a page. Each request relies on the one before it, like a chain. This slows down your site because the browser has to wait for each link in the chain to finish before it can move on.

What are Critical Requests?

Critical requests are those that your website needs to load first to display the main content. These can be files like CSS, JavaScript, and images. If these files load slowly, your webpage takes longer to appear to users.

How Chaining Happens

Imagine you have a web page. First, the browser loads the HTML. The HTML then asks for a CSS file. Once the CSS is loaded, it asks for a font file. After the font file, the CSS needs to load images. This creates a chain: HTML → CSS → Font → Images. Each step depends on the one before it. This can cause delays.

Impact of Chaining Critical Requests on Core Web Vitals

Chaining critical requests can slow down your website and hurt your Core Web Vitals. These vitals are important measures of your website’s performance. They include Largest Contentful Paint (LCP), First Input Delay (FID), and Cumulative Layout Shift (CLS). Let’s look at how chaining critical requests affects each of these.

Largest Contentful Paint (LCP)

LCP measures how long it takes for the main content of a page to load. If you have a chain of critical requests, each one depends on the previous one. This means your main content takes longer to load. For example, if your HTML needs to load a CSS file, and the CSS needs to load a font, and then an image, this chain slows down the LCP. Users will have to wait longer to see the main part of your page, which can be frustrating.

First Input Delay (FID)

FID measures how long it takes for your page to respond when a user first tries to interact with it. While FID mainly looks at how quickly your page reacts to user actions, chaining critical requests can indirectly slow it down. If the browser is busy handling a long chain of requests, it might not respond quickly to user input. This can make your site feel sluggish and unresponsive.

Cumulative Layout Shift (CLS)

CLS measures how much your page layout moves around while loading. If critical resources load slowly because of chaining, parts of your page might jump around as they finally appear. For instance, if images or fonts load late, they can push other content around, causing layout shifts. This can make your page look unstable and annoy users.

Examples

CSS and Fonts: Your HTML file loads a CSS file, which then loads a font file. This creates a chain.

JavaScript and Images: Your HTML file loads a JavaScript file, which then loads an image. This also creates a chain.

Third-Party Scripts: Widgets or ads from other servers can add more chains of critical requests.

How to Avoid Chaining Critical Requests

Avoiding chaining critical requests helps your website load faster and perform better. Here are step-by-step strategies to break these chains and improve your Core Web Vitals.

Step 1: Minimize Dependencies

Reducing the number of dependencies is the first step to avoid chaining critical requests. When your HTML file depends on several other files to load, it creates a chain of requests. Here’s how to minimize these dependencies:

  • Combine Files: Combine your CSS and JavaScript files. Instead of loading multiple CSS files, combine them into one. Do the same for JavaScript files. This reduces the number of requests the browser has to make.
  • Inline Critical CSS: Inline the most critical CSS directly in the HTML file. This means putting the CSS code needed to style the above-the-fold content directly in the HTML file. This reduces the need for an extra request to load CSS.
  • Remove Unused Code: Remove any unused CSS and JavaScript. This makes your files smaller and reduces the number of dependencies. Tools like PurifyCSS can help you identify and remove unused CSS.
  • Use Conditional Loading: Load certain files only when necessary. For example, if a particular JavaScript file is only needed on certain pages, load it conditionally. This avoids making unnecessary requests on pages where the file isn’t needed.

By minimizing dependencies, you reduce the number of chained requests, helping your page load faster.

Step 2: Preload Key Resources

Preloading key resources ensures that the most important files are loaded as soon as possible. This helps break the chain of critical requests. Here’s how to do it:

Use <link rel=”preload”>: Preload your critical CSS, JavaScript, and fonts. This tells the browser to load these resources as soon as it encounters the HTML file.

html

<link rel="preload" href="critical.css" as="style">

<link rel="preload" href="critical.js" as="script">

<link rel="preload" href="font.woff2" as="font" type="font/woff2" crossorigin="anonymous">

Prioritize Key Resources: Identify which resources are critical for the initial rendering of your page. Preload these resources to ensure they are available as soon as the browser starts loading the page.

Optimize Fonts: Preload fonts to avoid delays caused by font loading. Use font-display: swap in your CSS to ensure text remains visible during font loading.

css

@font-face {
font-family: 'MyFont';
src: url('font.woff2') format('woff2');
font-display: swap;

}

By preloading key resources, you ensure that the most important files are loaded quickly, reducing the impact of chained requests.

Step 3: Optimize Resource Loading

Optimizing how your resources are loaded can significantly reduce the time it takes for your page to load. Here’s how to optimize resource loading:

Compress Files: Use gzip or Brotli compression to reduce the size of your CSS, JavaScript, and HTML files. Smaller files load faster, reducing the time spent on each request.

Asynchronous Loading: Load non-critical JavaScript files asynchronously. This means the browser can continue loading other resources while the JavaScript file loads in the background.
html


<script src="non-critical.js" async></script>

Defer Non-Critical JavaScript: Defer the loading of JavaScript files that are not needed immediately. This prevents them from blocking the rendering of your page.
html


<script src="non-critical.js" defer></script>

Lazy Load Images and Videos: Use lazy loading for images and videos to load them only when they come into the viewport. This reduces the initial load time.
html


<img src="image.jpg" loading="lazy" alt="Lazy Loaded Image">

By optimizing resource loading, you ensure that your critical resources are loaded quickly and efficiently, improving your page’s performance.

Step 4: Optimize Server Response Times

Fast server response times are crucial for reducing the time it takes to load your page. Here’s how to optimize your server response times:

Use a Content Delivery Network (CDN): A CDN distributes your content across multiple servers worldwide. This means users can download your files from a server close to them, reducing load times.

Cache Static Resources: Use caching to store static resources like CSS, JavaScript, and images. This reduces the number of requests to the server.
html


<meta http-equiv="Cache-Control" content="public, max-age=31536000">

Optimize Server Performance: Ensure your server is optimized for performance. Use server-side caching, optimize database queries, and reduce server processing time.

Monitor Server Response Times: Use tools like Google PageSpeed Insights or WebPageTest to monitor your server response times. Identify and fix any bottlenecks.

By optimizing server response times, you ensure that your critical resources are delivered quickly, reducing the impact of chained requests.

Step 5: Use Best Practices for Web Development

Following best practices for web development helps you avoid chaining critical requests and ensures your page loads quickly. Here are some best practices to follow:

  • Reduce Redirects: Avoid unnecessary redirects. Each redirect creates an additional request, slowing down your page.
  • Use HTTP/2: HTTP/2 allows multiple requests to be sent over a single connection, reducing the impact of chained requests.
  • Optimize Third-Party Scripts: Third-party scripts like ads and widgets can create additional chained requests. Optimize these scripts or consider removing unnecessary ones.
  • Regular Audits: Regularly audit your website for performance. Use tools like Lighthouse, PageSpeed Insights, and WebPageTest to identify and fix performance issues.

By following these best practices, you can avoid chaining critical requests and ensure your page loads quickly and efficiently.

Avoiding chaining critical requests is key to improving your website’s performance and Core Web Vitals. By minimizing dependencies, preloading key resources, optimizing resource loading, improving server response times, and following best practices, you can ensure your website loads quickly, providing a better experience for your users.

Avoiding chaining critical requests is crucial for improving your website’s performance and user experience. By understanding what chaining critical requests are and their impact on Core Web Vitals, you can take proactive steps to minimize dependencies, preload key resources, optimize resource loading, and improve server response times. Using tools like Google Lighthouse, PageSpeed Insights, WebPageTest, and Chrome DevTools, you can monitor your website’s performance, identify issues, and implement best practices for optimization. These efforts will lead to faster load times, better Core Web Vitals scores, and a more satisfying experience for your users.